
 Real-time time-series plot
First of all thank you very much for such a great library.
I am using this to display static data of ECG and it works perfect for me.
Now I am trying to use this for real-time ECG monitor.
I am having some issue,
The graph need to refresh at interval of 250 ms.
Total points contains in the graph 1250.
When I am trying to add new point in the series and try to refresh the plotmodel, the system slows down.
Kindly guide me to achieve this functionality.
I request you to kindly add example in the example browser for Real-Time Time-Series plot.
Some similar examples are,
FLOT
SciChart
Visifire

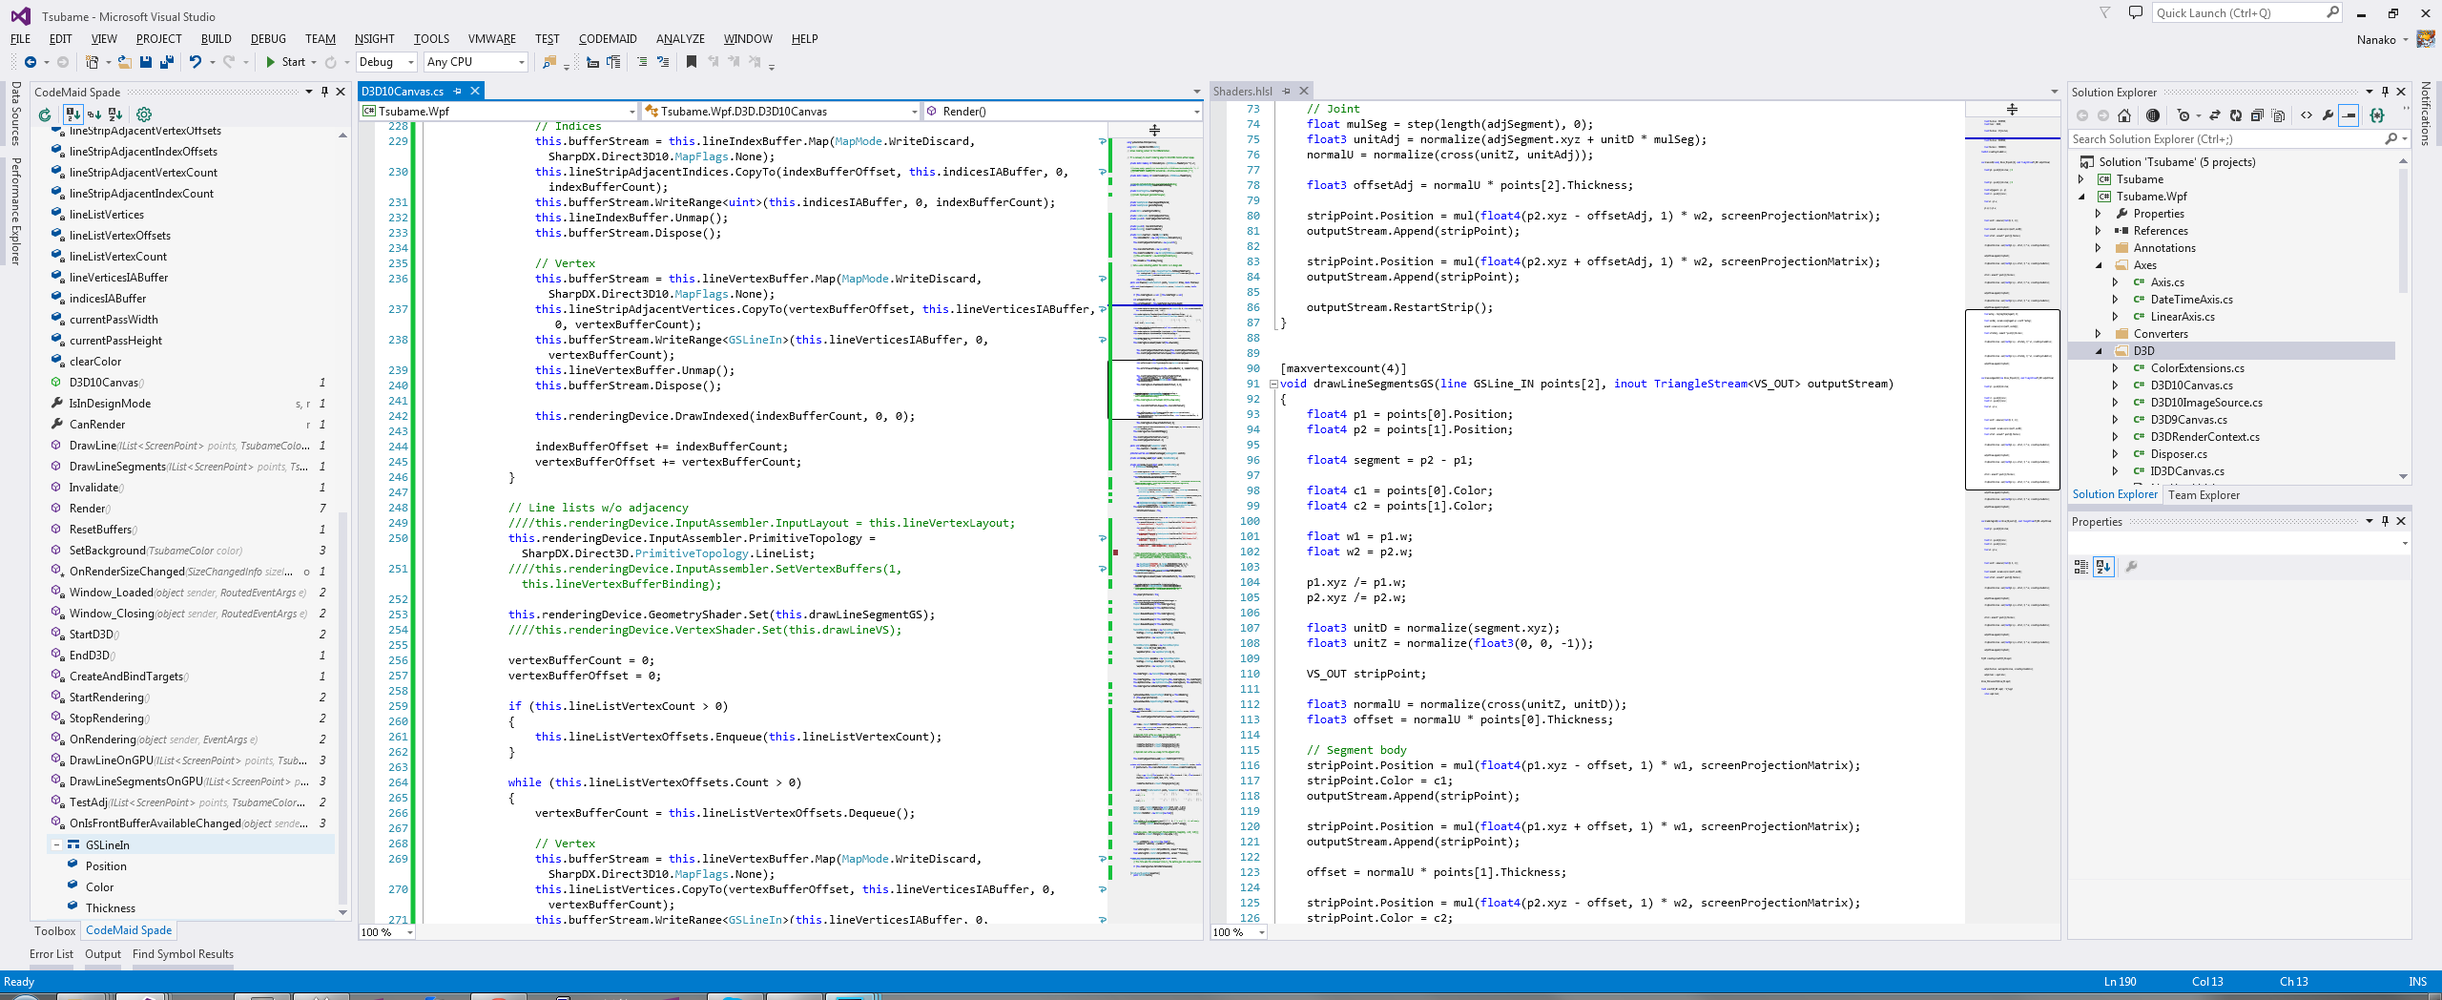
Direct3D 10 Renderer fork of OxyPlot, I've done it
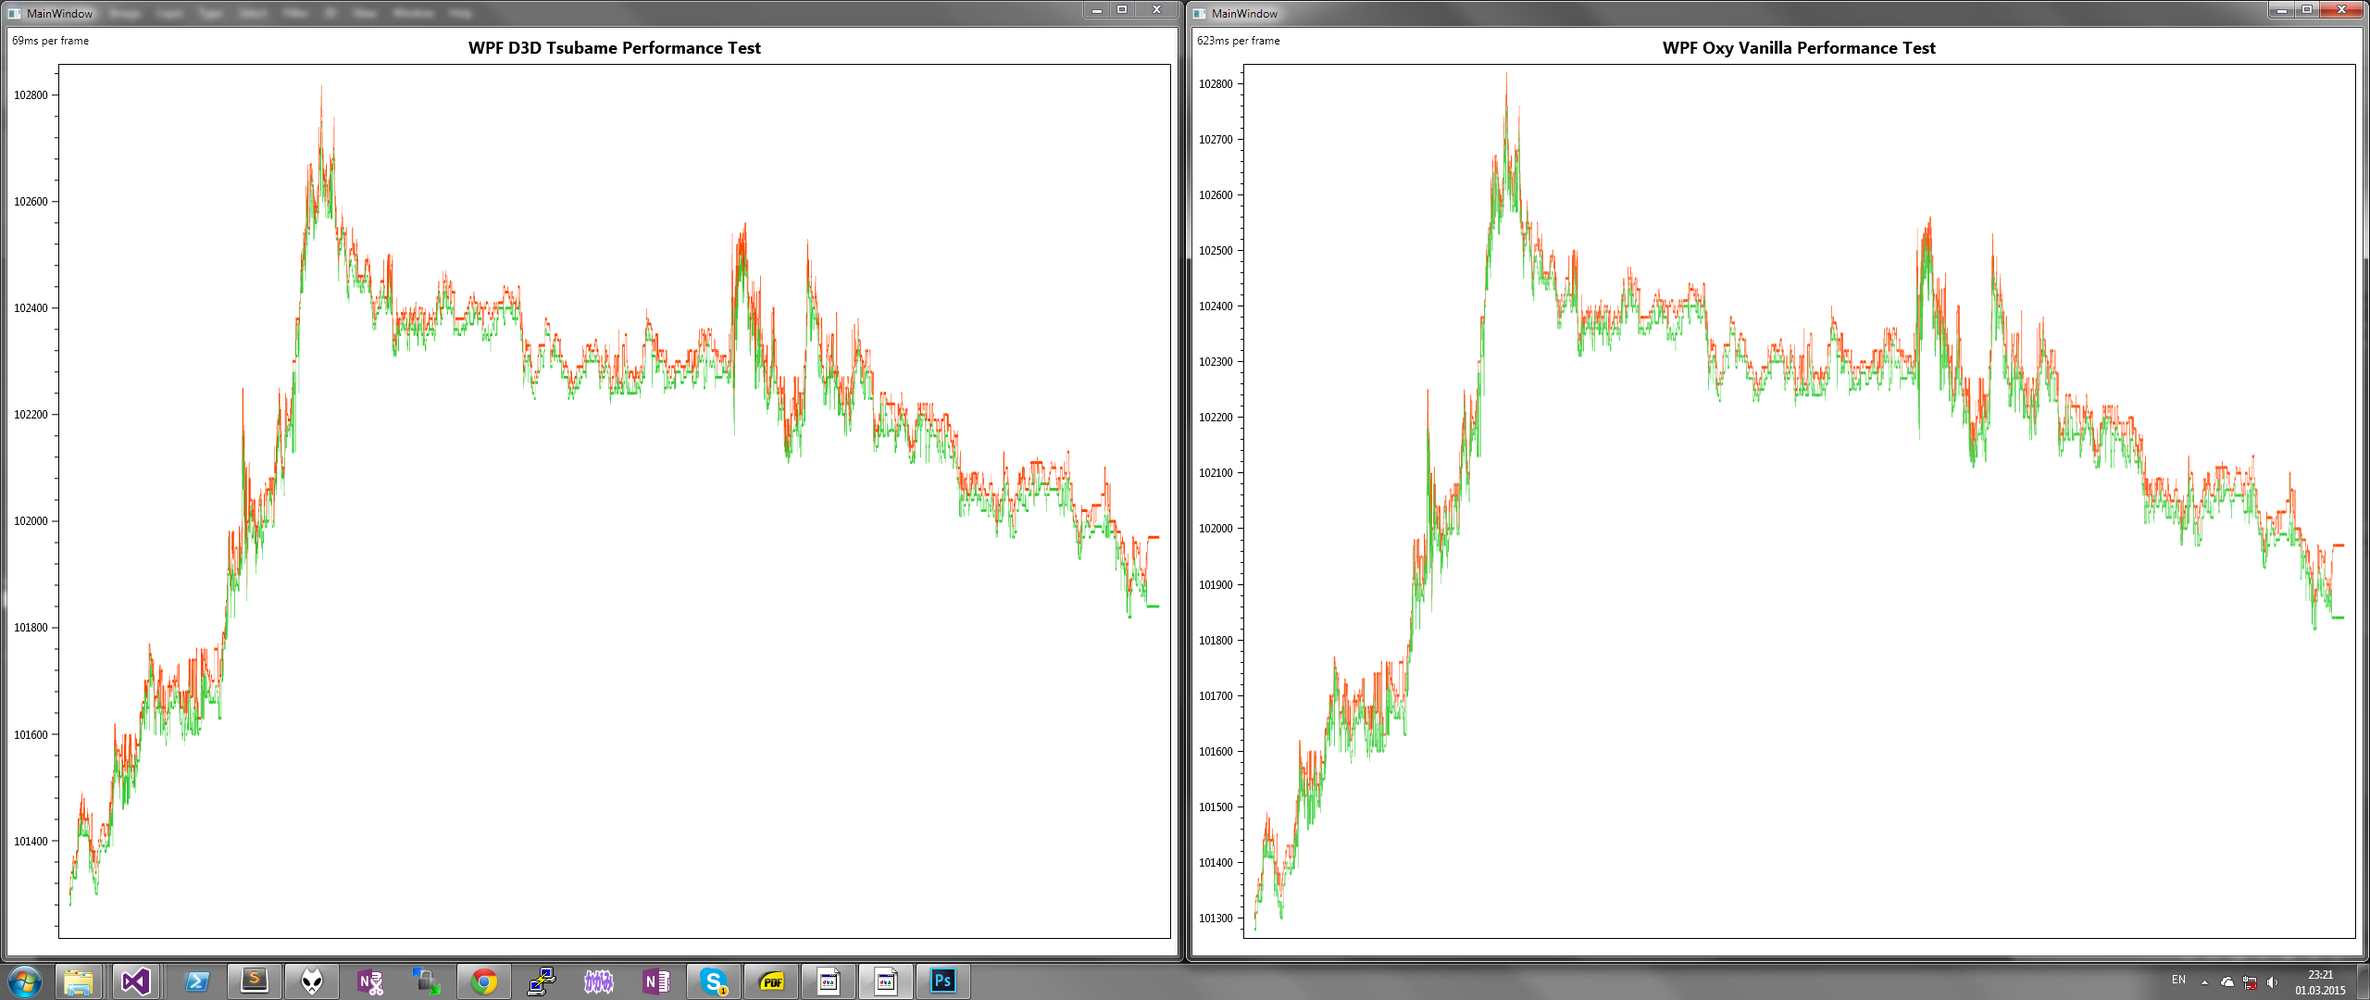
Works only on Direct3D10, but I assume it can be ported to Direct3D9
The problem is: I want to contribute to OxyPlot, but I guess I'd better put an opensource fork with credits, so someone can port rendering from it to Oxy. Rendering is kinda heavily optimised now, all up to LineSeries itself, and I will continue to get rid of unnecessary stuff. Right now actual rendering is mostly carried out by geometry shaders. I push raw points' data in screen coords to the vertex buffers as line lists and strips, and shaders process it into triangle stripes. Now, for example, I'm moving line clipping routines to the vertex shader stage frustum culling. I'd like to move screen coords transformation to the shader stage too in the nearest future.
So stay tuned, major performance breakthrough for OxyPlot is near.

 Realtime plotting - coding examples
I think it would be extremely useful to add several offical(by oxyplot experts) real-time high performance plotting examples to http://resources.oxyplot.org/examplebrowser/
It seems there is a high demand for such functionality and zero "official" examples.
There is a great confusion on how to do it correctly with all the performance issues in mind.
Thanks,
Mike

Knowing when InvalidePlot (Rendering) has completed
I call MyPlot.InvalidatePlot(true); from the main GUI thread. If my understanding is correct, InvalidatePlot works on another thread. Presumeably, it must get back on the GUI thread to actually plot data. I tried using the following:
Mouse.OverrideCursor = Cursors.Wait;
MyPlot.InvalidatePlot(true);
Mouse.OverrideCursor = null;
and other similar ideas but to no avail. I'm guessing that InvalidatePlot is a non blocking call. What I really need to do is switch to Cursors.Wait and then in some event, set the cursor back again. I was hoping for something like:
MyPlot.RenderingCompleted or some such thing. Can someone give me some pointers?
Regards,
Dave

Keeping the X axis scale and scrolling to the rightmost?
The X axis is time, and data points are added in real time. The default behaviour seems (I did nothing but calling InvalidatePlot(true)) showing all data points by shrinking the entire graph. This is not what I want.
What I want is keeping the current scale (whichever the user has set by his/her mouse wheel) of the X axis as it is, and scrolling to the rightmost when new data points are added. Note that the data points are not added in the exactly same time interval. That is, one can be added at 0:01, the next one at 0:03 and the next one at 0:04.
Is this possible? I tried to set Minimum (users may scroll horizontally to the left before the first visible data point) and Absolute Maximum (users are not allowed to scroll horizontally to the right beyond the last data point) but it still was shrinking.

OxyPlot Xamarin.Android Dynamic Plot Performance
Hi All,
I am using Xamarin.Android.OxyPlot to do dynamic data plot.
Here my questions is:
(1 )
When there are multi PlotViews on screen, there seems to be a “interference” between each other.Now the situation is : I have 4 plotviews on-screen, I create a invalidatePlot_new(Dirty Rect) method to draw partially for one plotview, picturing 1st plotView draw partially everytime, the other 3 call InvalidatePlot(true) by default(which will redraw entire view everytime). Why the 1st also redraw entire View also? It seems that 1st plotView is also following the others. It only draw partially when I set all 4 plotviews to call invalidatePlot_new(Dity Rect).
(2)
Second question is, I am fetching data at HIGH Frequency(2k Hz or more). I assume plotView could draw 20 times/sec with 100 plots every time. Well in fact it takes much longer to finish one plotView (60ms or more). I understand that a lot of Customized Canvas Draw happening which takes tons of CPU usage( 40% or more). So is there anyway I could decrease CPU usage, I’ve heard that using drawLines() instead of drawPath() will be more efficient. My goal is to limit each OnDraw() lower than 40ms( I can get 25 fps at least), also CPU usage lower than 30% since I will add more features based on this project.
Since not too many docs about Xamarin.Android.Oxyplot, so I hope this the right place I could get some help.
Of course, thanks for your great work, I really enjoy working with OxyPlot Library. Thanks ahead for you guys.

 TimeSpanAxis throwing FormatException
Clicking on the marker is throwing "FormatException".The problem occurs in the ExampleBrowser also. To reproduce the problem just open ExampleBrowser -> TimeSpanAxis example, click on any marker.
Exception details:
System.FormatException was unhandled by user code
HResult=-2146233033
Message=Input string was not in a correct format.
Source=mscorlib
StackTrace:
at System.Globalization.TimeSpanFormat.FormatCustomized(TimeSpan value, String format, DateTimeFormatInfo dtfi)
at System.Globalization.TimeSpanFormat.Format(TimeSpan value, String format, IFormatProvider formatProvider)
at System.TimeSpan.ToString(String format, IFormatProvider formatProvider)
at System.Text.StringBuilder.AppendFormat(IFormatProvider provider, String format, Object[] args)
at System.String.Format(IFormatProvider provider, String format, Object[] args)
at OxyPlot.StringHelper.Format(IFormatProvider provider, String formatString, Object item, Object[] values) in c:\projects\oxyplot\Source\OxyPlot\Utilities\StringHelper.cs:line 65
at OxyPlot.PlotElement.Format(String formatString, Object item, Object[] values) in c:\projects\oxyplot\Source\OxyPlot\PlotModel\PlotElement.cs:line 163
at OxyPlot.Series.DataPointSeries.GetNearestPoint(ScreenPoint point, Boolean interpolate) in c:\projects\oxyplot\Source\OxyPlot\Series\DataPointSeries.cs:line 109
at OxyPlot.Series.LineSeries.GetNearestPoint(ScreenPoint point, Boolean interpolate) in c:\projects\oxyplot\Source\OxyPlot\Series\LineSeries.cs:line 343
at OxyPlot.Series.Series.HitTestOverride(HitTestArguments args) in c:\projects\oxyplot\Source\OxyPlot\Series\Series.cs:line 141
at OxyPlot.UIElement.HitTest(HitTestArguments args) in c:\projects\oxyplot\Source\OxyPlot\Graphics\UIElement.cs:line 64
at OxyPlot.Model.<HitTest>d__0.MoveNext() in c:\projects\oxyplot\Source\OxyPlot\Graphics\Model.cs:line 72
at OxyPlot.Model.HandleMouseDown(Object sender, OxyMouseDownEventArgs e) in c:\projects\oxyplot\Source\OxyPlot\Graphics\Model.MouseEvents.cs:line 88
at OxyPlot.ControllerBase.HandleMouseDown(IView view, OxyMouseDownEventArgs args) in c:\projects\oxyplot\Source\OxyPlot\Graphics\ControllerBase.cs:line 82
at OxyPlot.Wpf.PlotView.OnMouseDown(MouseButtonEventArgs e) in c:\projects\oxyplot\Source\OxyPlot.Wpf\PlotView.cs:line 588
at System.Windows.UIElement.OnMouseDownThunk(Object sender, MouseButtonEventArgs e)
at System.Windows.Input.MouseButtonEventArgs.InvokeEventHandler(Delegate genericHandler, Object genericTarget)
at System.Windows.RoutedEventArgs.InvokeHandler(Delegate handler, Object target)
at System.Windows.RoutedEventHandlerInfo.InvokeHandler(Object target, RoutedEventArgs routedEventArgs)
at System.Windows.EventRoute.InvokeHandlersImpl(Object source, RoutedEventArgs args, Boolean reRaised)
at System.Windows.UIElement.RaiseEventImpl(DependencyObject sender, RoutedEventArgs args)
at System.Windows.UIElement.RaiseTrustedEvent(RoutedEventArgs args)
at System.Windows.UIElement.RaiseEvent(RoutedEventArgs args, Boolean trusted)
at System.Windows.Input.InputManager.ProcessStagingArea()
at System.Windows.Input.InputManager.ProcessInput(InputEventArgs input)
at System.Windows.Input.InputProviderSite.ReportInput(InputReport inputReport)
at System.Windows.Interop.HwndMouseInputProvider.ReportInput(IntPtr hwnd, InputMode mode, Int32 timestamp, RawMouseActions actions, Int32 x, Int32 y, Int32 wheel)
at System.Windows.Interop.HwndMouseInputProvider.FilterMessage(IntPtr hwnd, WindowMessage msg, IntPtr wParam, IntPtr lParam, Boolean& handled)
at System.Windows.Interop.HwndSource.InputFilterMessage(IntPtr hwnd, Int32 msg, IntPtr wParam, IntPtr lParam, Boolean& handled)
at MS.Win32.HwndWrapper.WndProc(IntPtr hwnd, Int32 msg, IntPtr wParam, IntPtr lParam, Boolean& handled)
at MS.Win32.HwndSubclass.DispatcherCallbackOperation(Object o)
at System.Windows.Threading.ExceptionWrapper.InternalRealCall(Delegate callback, Object args, Int32 numArgs)
at MS.Internal.Threading.ExceptionFilterHelper.TryCatchWhen(Object source, Delegate method, Object args, Int32 numArgs, Delegate catchHandler)
InnerException:


Thread safety and RenderPoints
> System.InvalidOperationException occurred
> HResult=-2146233079
> Message=Collection was modified; enumeration operation may not execute.
> Source=mscorlib
> StackTrace:
> at System.Collections.Generic.List`1.Enumerator.MoveNextRare()
Seems to be because ICollection is being used here:
https://github.com/oxyplot/oxyplot/blob/develop/So...
Would it be better to use one of the concurrent collects for this?
multiple plots
I would like to know if there is an easy way to create multiple subplots in a single PlotModel.
Obviously I can just create several PlotModels and achieve something similar, but is there a better more elegant way to do it?
Thanks,
Mike
Service d'assistance aux clients par UserEcho

