- General
-
 Questions

0
Show only the added datapoints at the x axis
Hello,
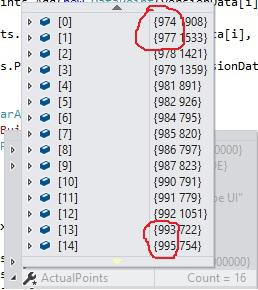
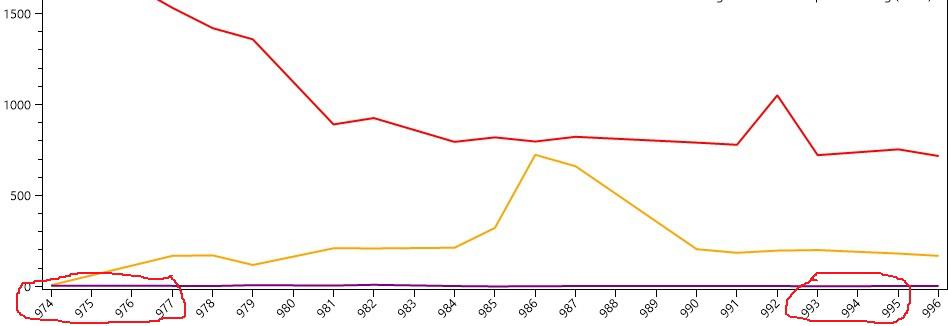
I want to create a line chart with three series. Each series have the same data values for the x axis.
My problem is that, the x axis interpolate the values between the data points.
Is there a possibility to change this behaviour.
Customer support service by UserEcho
