- General
-
 Questions

Is it possible or planned...
ffiala wrote at 2012-02-21 07:45:
- ...to overlay different ploting series in one ploting area?
- ...to add annotations to each datapoint?
- ...to position these annotations outside of the ploting area?
The result shoud be something like this: 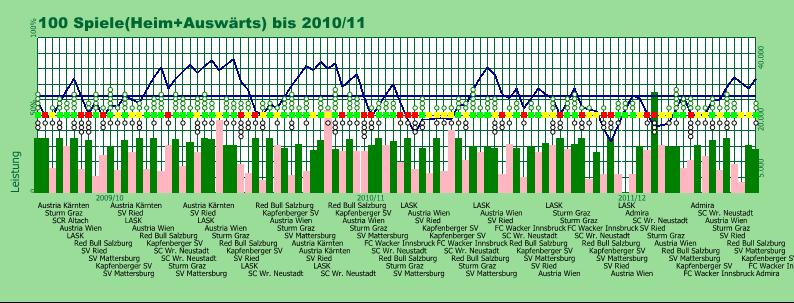
objo wrote at 2012-02-23 21:08:
Yes, you can overlay any number of plotting series in the same plot - it should not be any problem to combine line, scatter points and columns (bar) series as in your example.
You can create a string for each data point that will be shown when you use the mouse tracker, but currently only the BarSeries has the ability to render labels (will add this to the other series later).
You can create your own custom annotatiosn that renders in screen coordinates, anywhere in the control area.
You could also create a custom x-axis to render the club names. Simply override the Render method.
ffiala wrote at 2012-02-26 12:56:
I have now an OxyPlot version of my plot:
Using the Oxyplot library without changes of source code.
Thank You for support, Franz
Customer support service by UserEcho
