- General
-
 Питання

0
Є відповідь
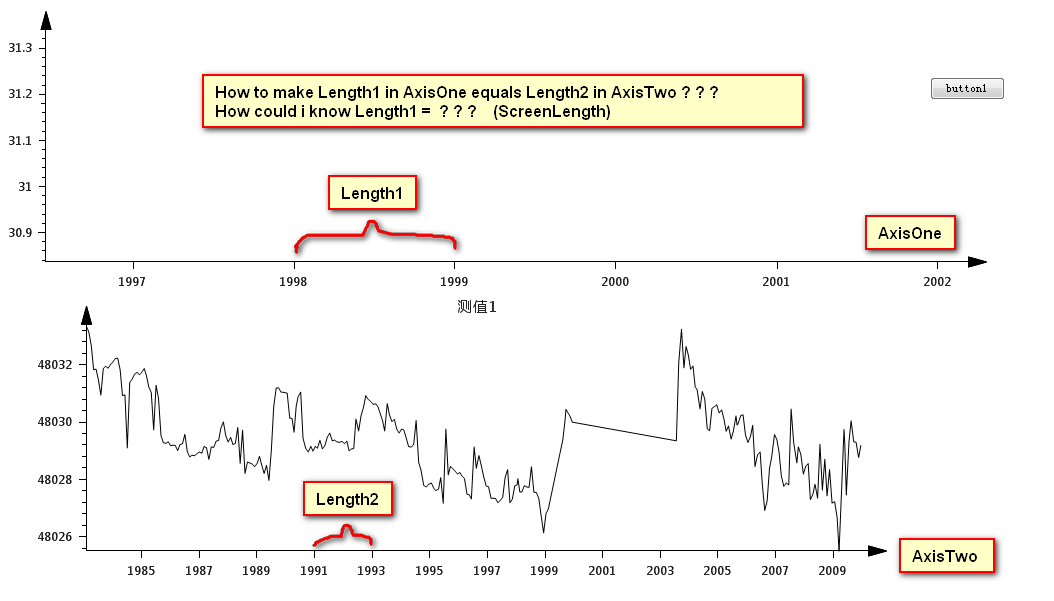
How to set the length of two ticks in DateTimeAxis ?
help me . my problem is described here.
Служба підтримки клієнтів працює на UserEcho

I think this should be covered by the following feature request: https://github.com/oxyplot/oxyplot/issues/13