- General
-
 Questions

0
WPF and Oxyplot: graph with CategoryAxis and LogarithmicAxis
Hello everyone,
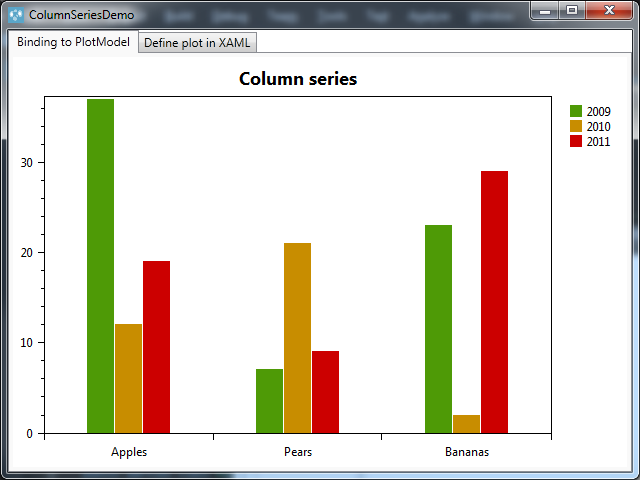
I am currently playing with Oxyplot and the demo samples (that one can download there https://github.com/oxyplot/oxyplot/archive/develop.zip), more particulary the sample 'ColumnSeriesDemo'.
Here is what it loks like when executed:
Code:
public MainWindow()
{
this.InitializeComponent();
// Create some data
this.Items = new Collection<Item>
{
new Item {Label = "Apples", Value1 = 37, Value2 = 12, Value3 = 19},
new Item {Label = "Pears", Value1 = 7, Value2 = 21, Value3 = 9},
new Item {Label = "Bananas", Value1 = 23, Value2 = 2, Value3 = 29}
};
// Create the plot model
var tmp = new PlotModel { Title = "Column series", LegendPlacement = LegendPlacement.Outside, LegendPosition = LegendPosition.RightTop, LegendOrientation = LegendOrientation.Vertical };
// Add the axes, note that MinimumPadding and AbsoluteMinimum should be set on the value axis.
tmp.Axes.Add(new CategoryAxis { ItemsSource = this.Items, LabelField = "Label" });
tmp.Axes.Add(new LinearAxis { Position = AxisPosition.Left, MinimumPadding = 0, AbsoluteMinimum = 0 });
// Add the series, note that the BarSeries are using the same ItemsSource as the CategoryAxis.
tmp.Series.Add(new ColumnSeries { Title = "2009", ItemsSource = this.Items, ValueField = "Value1" });
tmp.Series.Add(new ColumnSeries { Title = "2010", ItemsSource = this.Items, ValueField = "Value2" });
tmp.Series.Add(new ColumnSeries { Title = "2011", ItemsSource = this.Items, ValueField = "Value3" });
this.Model1 = tmp;
this.DataContext = this;
}
I would like to have a logarithmic Y axis.
In the code above, I change the second axis declaration from
tmp.Axes.Add(new LinearAxis { Position = AxisPosition.Left, MinimumPadding = 0, AbsoluteMinimum = 0 });
To
tmp.Axes.Add(new LogarithmicAxis { MinorTickSize = 0, Minimum = 1, Maximum = 35, Title = "Log Axis", Position = AxisPosition.Left, Base = 10, TickStyle = TickStyle.Outside });
However, when executing the code, the result is as follow:
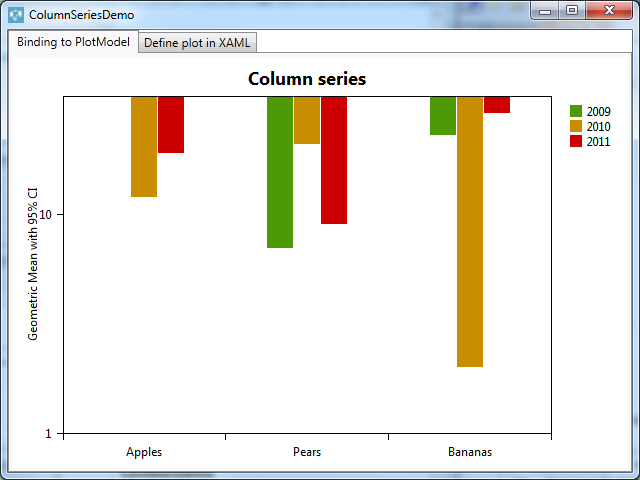
What am I missing please?
Customer support service by UserEcho

The weird thing is it works fine when I do the same thing in the BarSeriesDemo, the difference is that the log axis is on the bottom and the category axis on the left o_O