- General
-
 Preguntes

Fill area above and below baseline
This discussion was imported from CodePlex
alex4Zero wrote at 2014-03-07 07:12:
Hi,
Does anybody knows how to paint this kind of graphic with oxyplot?
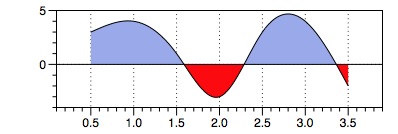
The idea is to fill areas above of some baseline with one color and another color below baseline?
Does anybody knows how to paint this kind of graphic with oxyplot?
The idea is to fill areas above of some baseline with one color and another color below baseline?
objo wrote at 2014-03-07 15:24:
I think this is a new feature, but it would be nice to add a series type that draws this in the core library! It is somewhat similar to the
https://oxyplot.codeplex.com/workitem/10150
TwoColorLineSeries class. Maybe we can create a new TwoColorAreaSeries? Or can you suggest a better name?
https://oxyplot.codeplex.com/workitem/10150
alex4Zero wrote at 2014-03-10 09:14:
objo wrote:
I think this is a new feature, but it would be nice to add a series type that draws this in the core library! It is somewhat similar to theCurrently we did it with 2 area series. One is above baseline, one is below. For me it looks like an AreaSeries with BaseLine. Probably BaselineAreaSeries?TwoColorLineSeriesclass. Maybe we can create a newTwoColorAreaSeries? Or can you suggest a better name?
https://oxyplot.codeplex.com/workitem/10150
skichuk wrote at 2014-03-10 09:30:
Currently we did it with 2 area series. One is above baseline, one is below. For me it looks like an AreaSeries with BaseLine. Probably BaselineAreaSeries?
Yes it is two AreaSeries and one is LineSeries, user of this type of graph should now only about LineSeries, and two Colors below and above Baseline and the coordinate of this base line if it is horizontal it will be vertical coordinate for example BaseLineY
Customer support service by UserEcho
