- General
-
 Küsimused

+2
Ülevaatamisel
Areaseries: Fill area below baseline (realtime)
Hi,
currently I'm implementing a realtime chart and so far I have the following:
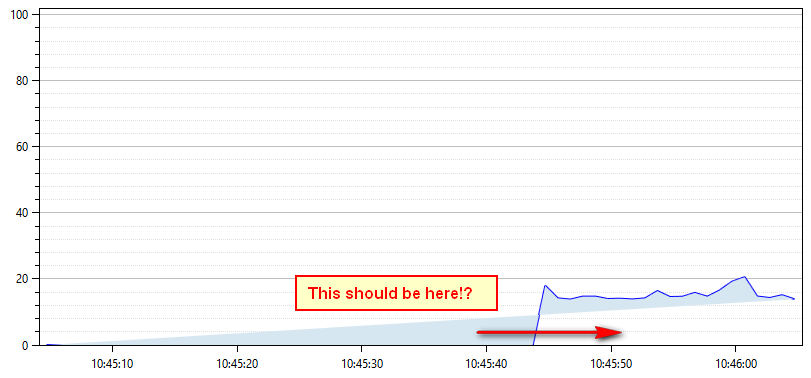
But I want something like this:
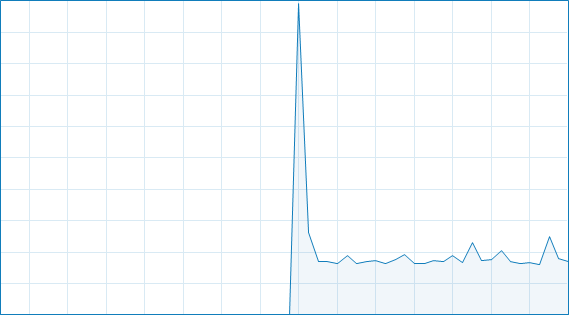
Any ideas how to achieve this? Here's the source code:
currently I'm implementing a realtime chart and so far I have the following:
But I want something like this:
Any ideas how to achieve this? Here's the source code:
/// <summary>
/// Setup Plot
/// </summary>
private void SetupPlot()
{
    this.time = DateTime.Now;

    this.Plot = new PlotModel();

    this.Plot.Axes.Add(new LinearAxis()
                                    {
                                      IsZoomEnabled = false,
                                      Maximum = 102,
                                      Minimum=0,
                                      MajorGridlineStyle = LineStyle.Solid,
                                      MinorGridlineStyle = LineStyle.Dot,
                                      Position = AxisPosition.Left
                                    });

    this.Plot.Axes.Add(new DateTimeAxis()
                                    {
                                        IsZoomEnabled = false,
                                        Position = AxisPosition.Bottom,
                                    });

    var areaSeries = new AreaSeries()
    {
        StrokeThickness = 2,
        LineStyle = OxyPlot.LineStyle.Solid,
        Color = OxyColors.Blue,
        Color2 = OxyColors.Transparent,
        Fill = OxyColor.FromRgb(214, 231, 242),
        DataFieldX2 = "X",
        ConstantY2 = 0
    };

    // Fill series with initial values
    for (int i = 0; i < 60; i++)
    {
        areaSeries.Points.Add(new DataPoint(DateTimeAxis.ToDouble(time.Subtract(new TimeSpan(0, 0, 60 - i))), 0));
    }

    this.Plot.Series.Add(areaSeries);
}
Update of the Plot (every second):void timer_Tick(object sender, EventArgs e)
{
var areaSeries = (AreaSeries)this.Plot.Series[0];
if (areaSeries.Points.Count > 60)
{
areaSeries.Points.RemoveAt(0);
}
// Update-Plot
double percentage = GetPercentage();
areaSeries.Points.Add(new DataPoint(DateTimeAxis.ToDouble(this.time), percentage));
time = time.AddSeconds(1);
this.Plot.InvalidatePlot(true);
}Many Thanks!Customer support service by UserEcho

Steve,
I've encountered the very problem and - even though the docs state that it should work using ConstantY2 - after skimming the source code I believe that this is not implemented at the moment. Anyway, you can easily work this around by using the Points2 collection
This ain't really beautiful, but it works.
Hi P.k,
great it works now ;-) Thanks for the hint! Now that the chart looks like this:
Perfect!
Best regards,
Steve
https://github.com/oxyplot/oxyplot/issues/662