- General
-
 Technische problemen

0
Under review
Colum items not rendered properly when using a logarithmic Y axis
Please see the following discussion: http://discussion.oxyplot.org/topic/1041241-/
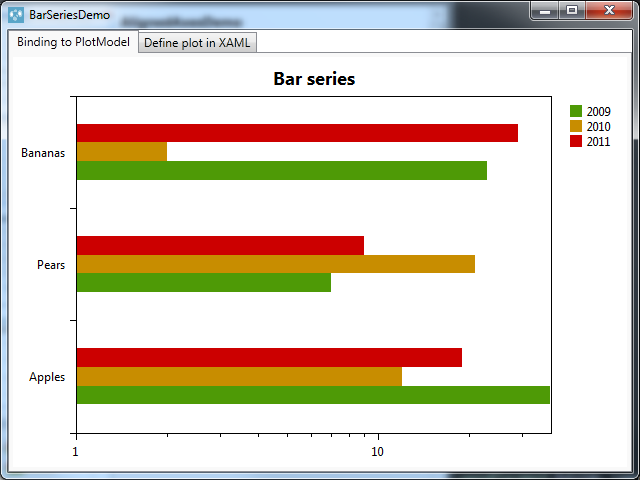
In the oxyplot sample, there are two demos making use of Bars and Columns: BarSeriesDemo and ColumnSeriesDemo.
For the first, using a logarithmic axis in place of the linear one as Y axis does not cause any problem, the values are displayed correctly:
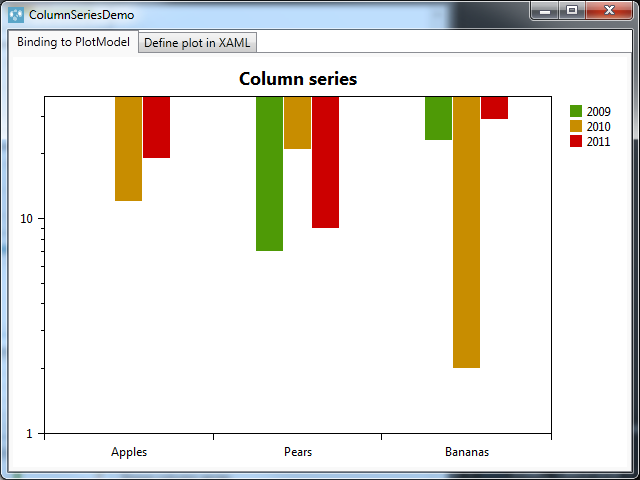
However, when doing the same with the demo ColumnSeriesDemo, the bars are not drawn correctly it seems, looks like they are "reversed":
In the class ColumnSeriesDemo.MainWindow, I changed the lines 43 and 44 from
tmp.Axes.Add(new CategoryAxis { ItemsSource = this.Items, LabelField = "Label" });
tmp.Axes.Add(new LinearAxis { Position = AxisPosition.Left, MinimumPadding = 0, AbsoluteMinimum = 0 });
To
tmp.Axes.Add(new CategoryAxis { Position = AxisPosition.Bottom, ItemsSource = this.Items, LabelField = "Label" });
tmp.Axes.Add(new LogarithmicAxis { Position = AxisPosition.Left, Minimum = 1, Base = 10 });
With code behind:
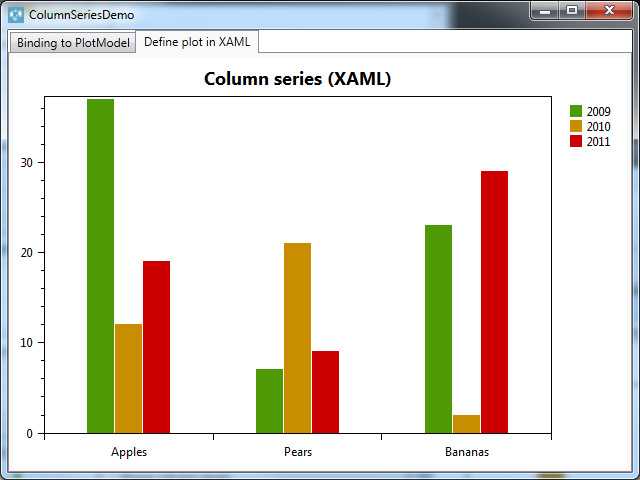
With xaml, without the log Y axis:
Customer support service by UserEcho

In OxyPlot_NET40, in BarSeriesBase.cs, in public override void Render(IRenderContext rc)
If I change in line 235 the var baseValue to the min value of my Y logarithmic axis (1 in my case), it works fine.
You can also do this in the declaration of the ColumnSeries :
FYI
I would expect similar behaviour for bar and column series! Please add this as an issue!