- General
-
 Preguntas

+5
Keeping the X axis scale and scrolling to the rightmost?
My work is almost done, and this is the last (I hope) barrier I have encountered.
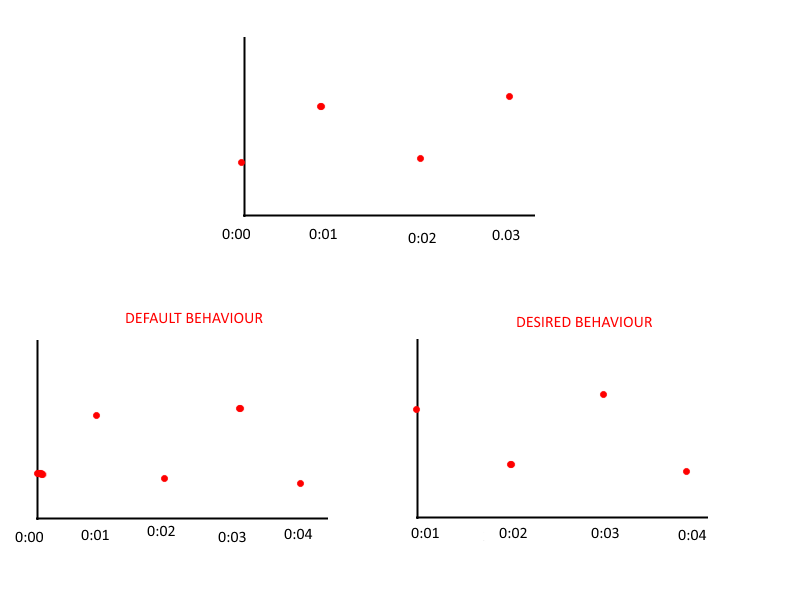
The X axis is time, and data points are added in real time. The default behaviour seems (I did nothing but calling InvalidatePlot(true)) showing all data points by shrinking the entire graph. This is not what I want.
What I want is keeping the current scale (whichever the user has set by his/her mouse wheel) of the X axis as it is, and scrolling to the rightmost when new data points are added. Note that the data points are not added in the exactly same time interval. That is, one can be added at 0:01, the next one at 0:03 and the next one at 0:04.
Is this possible? I tried to set Minimum (users may scroll horizontally to the left before the first visible data point) and Absolute Maximum (users are not allowed to scroll horizontally to the right beyond the last data point) but it still was shrinking.
0
Jeong-hun Sin hace 12 años
Servicio de atención al cliente por UserEcho
