- General
-
 Питання

multiple plots / subplots
This discussion was imported from CodePlex
priesen wrote at 2013-02-02 11:57:
hello oxyplotters
oxyplot looks very interesting to me, i may want to use it in a project.
i would like to know if oxyplot can handle multiple plots, i.e. aligning subplots and axes in the same form?
i came across the 'PositionTier' example which handles multiple axes on a single plot area.
i would like to handle multiple plots,
something like
http://matplotlib.org/examples/pylab_examples/subplots_demo.html
is oxyplot able to do such things? any example?
thank you very much for answering my questions,
pat
objo wrote at 2013-02-07 22:55:
Yes, you can have multiple axes covering the same area. Use the StartPosition and EndPosition properties of the axes to control the placement. The boxes around the sub-plots are currently not supported, that should be added as a new feature.
It is not possible to create multiple polar plots or pie series inside the same model.
It is not possible to create multiple polar plots or pie series inside the same model.
CMC wrote at 2013-02-08 02:44:
Hello priesen,
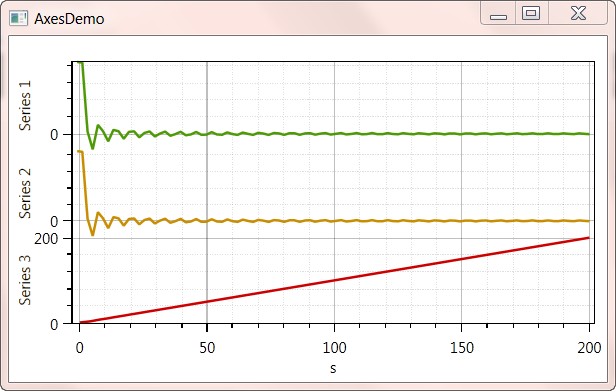
Do you mean like this? This is one Plot object with 3 series on 3 axes and since they are in the same Plot, they zoom/pan/etc. together.
Do you mean like this? This is one Plot object with 3 series on 3 axes and since they are in the same Plot, they zoom/pan/etc. together.
priesen wrote at 2013-02-09 09:10:
Thank you objo and CMC
So separate boxes are not supported, I see.
Can the above AxesDemo plot also be modified to include multiple x-Axes, i.e. like the plot below, to make the separation a bit clearer?

So separate boxes are not supported, I see.
Can the above AxesDemo plot also be modified to include multiple x-Axes, i.e. like the plot below, to make the separation a bit clearer?
CMC wrote at 2013-02-09 19:16:
Having an intermediate line or axis would be very nice. Maybe there is a way to do that, but I don't know. Here's a snippet that creates the axes and series and assigns the series to a specific axis... NOTE that the axis is given a "Key" and
the series' are given the appropriate YAxisKey. It took me a while to figure that out :)
        FunctionSeries s1 = new FunctionSeries(x => Math.Sin(x) / x, -1, 200, 100);
        var linearAxis1 = new LinearAxis();
        linearAxis1.EndPosition = 1;
        linearAxis1.StartPosition = .66;
        linearAxis1.MajorGridlineStyle = LineStyle.Solid;
        linearAxis1.MinorGridlineStyle = LineStyle.Dot;
        linearAxis1.Title = "Series 1";
        linearAxis1.Key = "Series 1";
        s1.YAxisKey = "Series 1";

        MyPlotModel.Axes.Add(linearAxis1);
        MyPlotModel.Series.Add(s1);

        //-----------------------------------

        FunctionSeries mfunc = new FunctionSeries(x => Math.Sin(x) / x, -1, 200, 100);
        var linearAxis2 = new LinearAxis();
        linearAxis2.EndPosition = 0.66;
        linearAxis2.StartPosition = 0.33;
        linearAxis2.MajorGridlineStyle = LineStyle.Solid;
        linearAxis2.MinorGridlineStyle = LineStyle.Dot;
        linearAxis2.Title = "Series 2";
        linearAxis2.Key = "Series 2";
        mfunc.YAxisKey = "Series 2";

        MyPlotModel.Axes.Add(linearAxis2);
        MyPlotModel.Series.Add(mfunc);

        //===================================================

        FunctionSeries mfunc3 = new FunctionSeries(x => x + Math.Sin(x) / x, 0, 200, 6000);
        var linearAxis3 = new LinearAxis();
        linearAxis3.EndPosition = 0.33;
        linearAxis3.StartPosition = 0.0;
        linearAxis3.MajorGridlineStyle = LineStyle.Solid;
        linearAxis3.MinorGridlineStyle = LineStyle.Dot;
        linearAxis3.Title = "Series 3";
        linearAxis3.Key = "Series 3";
        mfunc3.YAxisKey = "Series 3";

        MyPlotModel.Axes.Add(linearAxis3);
        MyPlotModel.Series.Add(mfunc3);

        //===================================================

        var linearAxis4 = new LinearAxis();
        linearAxis4.Position = AxisPosition.Bottom;
        linearAxis4.Title = "s";
        linearAxis4.MajorGridlineStyle = LineStyle.Solid;
        linearAxis4.MinorGridlineStyle = LineStyle.Dot;

MyPlotModel.Axes.Add(linearAxis4); Служба підтримки клієнтів працює на UserEcho
