Polar chart question
This discussion was imported from CodePlex
SamTauris wrote at 2014-06-27 12:35:
Hi
I'm struggling with following problem.
Hope you can help me out. :) !
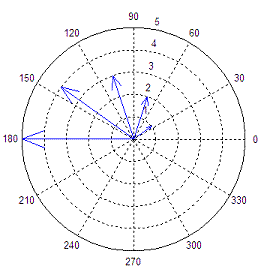
I try to achive something similar to

On my case I need one series per line, and have the first point of every series be the center of the chart.
Is this possible?
I'm struggling with following problem.
Hope you can help me out. :) !
I try to achive something similar to

On my case I need one series per line, and have the first point of every series be the center of the chart.
Is this possible?
objo wrote at 2014-06-27 13:09:
If using series is a requirement I think you need to create a custom series drawing the arrows. Otherwise I guess the
If you want to use one series per line, you must specify the colour of each series. Otherwise, the default colour will be different for each series.
The position of the magnitude axis labels is not yet customizable. This is covered by https://oxyplot.codeplex.com/workitem/10223
See the latest code checkin for an example that is close to your case!
ArrowAnnotation can be used. If you want to use one series per line, you must specify the colour of each series. Otherwise, the default colour will be different for each series.
The position of the magnitude axis labels is not yet customizable. This is covered by https://oxyplot.codeplex.com/workitem/10223
See the latest code checkin for an example that is close to your case!
SamTauris wrote at 2014-06-27 14:05:
Objo
Thanks for the FAST response ! It works!!
Thanks for the FAST response ! It works!!
Customer support service by UserEcho

