- General
-
 Fragen

How to Implement a PointCloudSeries for Large, Static Point Cloud Data
First off, Oxyplot is an amazing project - open source, high quality, MIT, tons of samples, even documentation :-) It covers many interesting use cases for me, but I hit one particular problem:
In WPF the pan/zoom performance is bad on large data sets (e.g. ScatterSeries with 100000 points). This is expected, of course, because of the rich interactiveness a ScatterSeries provides; no criticism. I experimented with various settings, also checking the performance guidelines (ScatterSeries, MarkerType=crosses seems to be best currently), but the result was not sufficient.
Use Case
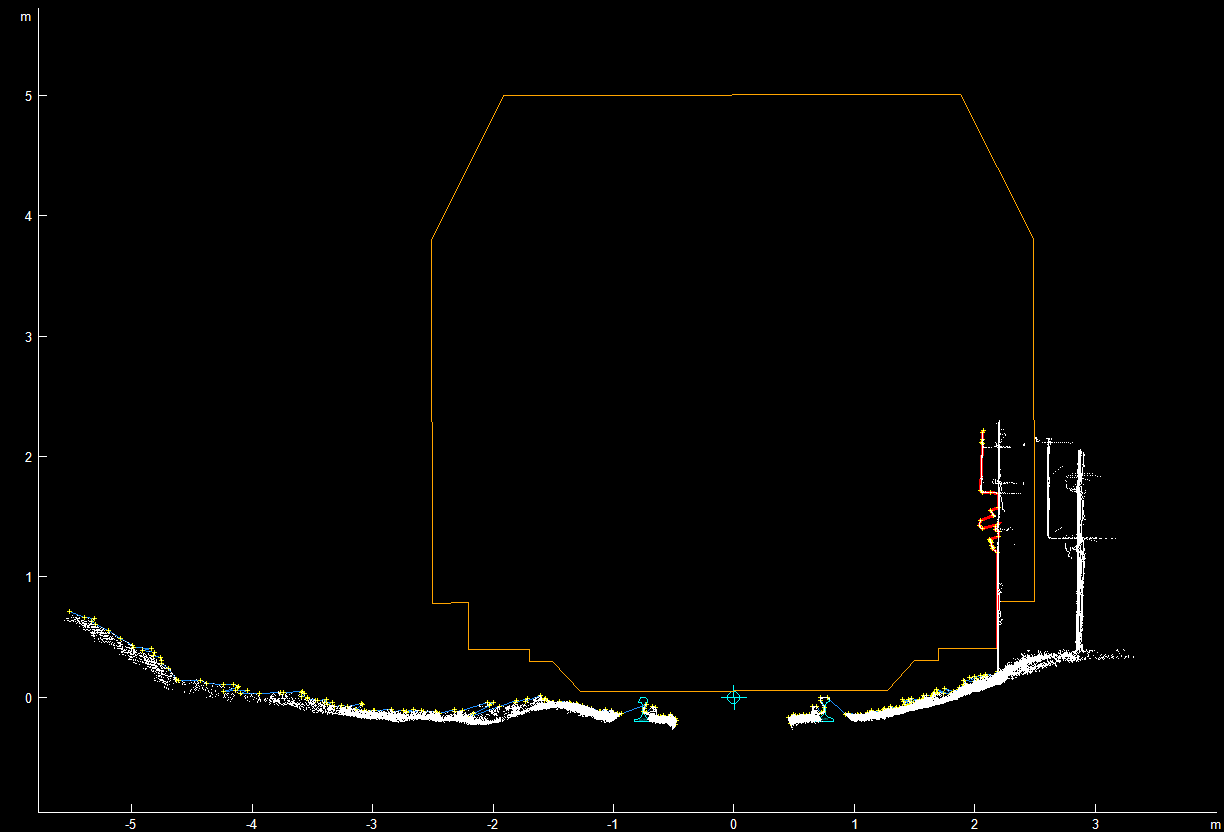
In the following screenshot you see
- White dots: about 90000 points from a laser scan
- Various line drawings on top
Goal
Implement a high performance oxyplot "Series" for large point clouds.
- The point cloud is static, initial loading time is less relevant
- A data point has x, y, color (or at least grayscale)
- The user can pan and zoom to investigate different areas - fast.
- Not sure about the tracker, yet.
Question
What's the best way to achieve this? Looking at the samples, I found that PolarHeatMapSeries has an image-based rendering mode, which allows for fast pan/zoom. There were some image annotations, too. Any directions are welcome. I'm willing to contribute, if it works out well.
Customer support service by UserEcho

I managed to render onto an image following the PolarHeatMapSeries example. Current results are kind of disappointing, order by performance:
I can see two options from here:
<please insert your terrific idea here> :-)
PS: OxyPlot ist still amazing for all other use cases. Great MVVM pattern in the WPF libraries.
Ok, checking the current rendering code of the ScatterSeries, there seems to be a lot of room for tuning when moving from "all-purpose" towards "tailored for many points". I guess, a custom implementation that strips the ScatterSeries to a bare minimum might be a good third option.
Talking to myself here :) Lets call it documentation.
Stripping the ScatterSeries to a minimum did help a little (but not worth the effort). The major impact was moving from two lines drawn per data point (plus marker) to one line of length 1, width 1. Cutting the WPF objects to half indeed boosts the performance significantly.
Custom rendering onto an image still looks best. However, more work has to be done for hyper efficient data retrieval (backing spatial tree structure to quickly cut the clipping rectangle out of the data).
The .Net Framework v4.7.2 has a WriteableBitmap class that allows high-performance rendering (90000 points fullscreen in 5ms). Such performance allows for smooth zoom/pan operations. As there was no interest at all, I'll implement this in my own library - just wanted to let others know that WriteableBitmap is an interesting alternative.
Hi Patrick,
Did you ever get the WriteableBitmap to work? If you did, any chance of seeing how you implemented it? Would it work for large linear series too?
Well, it would work, but either the drawing code would be complicated (draw lines with thickness?, crosses, stars, other markers!) or the result would look ugly (just lines). Key requirement is a very efficient data structure to go through all your data. I had to implement a new IRenderContext (by overriding the WPF CanvasRenderContext) with a specialized DrawImageSource method for my use case. In my custom large data series, I try to cast the render context to my implementation and call my own method. Not nice, not straight forward, but this was the only way to get the performance I needed.
For linear series you should first look into "Decimator" which reasonably limits the number of WPF objects on screen.
Otherwise... I'll paste my implementation of a WPF render context able to draw an WPF ImageSource (WritableBitmap implements ImageSource, too). You should be able to work your way up from there.
internal class ScanRenderContext : CanvasRenderContext { private readonly Canvas _canvas; private Image _pointCloudImage; /// <summary>Creates a new render context for fast image drawing without <see cref="OxyImage" /> round-trips.</summary> /// <param name="canvas">The canvas.</param> public ScanRenderContext(Canvas canvas) : base(canvas) { this._canvas = canvas; } public void DrawImageSource(ImageSource imageSource, ScreenPoint topLeft) { if (imageSource == null) { return; } // create image or replace source or just keep going? if (this._pointCloudImage == null) { // first call this._pointCloudImage = new Image {Source = imageSource}; this._canvas.Children.Add(this._pointCloudImage); } else if (this._pointCloudImage.Source != imageSource) { // subsequent call: source has changed this._pointCloudImage.Source = imageSource; } // subsequent call: all fine // OxyPlot always removes our image before rendering int index = this._canvas.Children.IndexOf(this._pointCloudImage); if (index < 0) { this._canvas.Children.Add(this._pointCloudImage); //this._canvas.Children.Insert(0, this._pointCloudImage); } // Set the position of the image Canvas.SetLeft(this._pointCloudImage, topLeft.X); Canvas.SetTop(this._pointCloudImage, topLeft.Y); } }Oh, and obviously this is a quite specialized solution for WPF. OxyPlot is a very generic library and has amazing support for different platforms. Of course, this comes with a performance penalty because it is difficult to map all drawing operations to appropriate architecture-specific methods. This was the other reason, why I didn't try to get this into a PR.