- General
-
 Questions

0
Oxyplot and multi labeled axis legend
I am creating a graph using the oxyplot library. I have to emulate a graph which, in Excel, looks like the following:
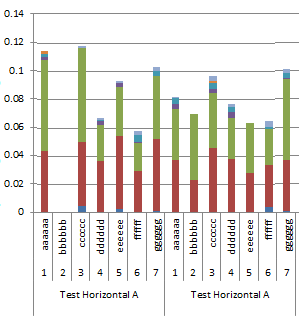
Is it possible to create such axis legend using Oxyplot? I can't seem to find any example in the source code nor on the internet.
Customer support service by UserEcho
