 Real time data for form application
Hi all,
I work on real time data in a form application. My data will be work real time and it will slides as oscilloscope waves.
How can I do that? I just see Wpf example in library documents but I have to work form application.
I am rookie at oxyplot. Sorry about if I am wrong
Thanks in advance

 Zoom problem when absolute minimum and maximum is set
Hi!
I have found a bug which is related to zooming.
When absolute minimum and maximum is set and one of the axes have a larger range, zooming out will compress the series and when you zoom in the series remains compressed.
Please edit zoom methods to keep axis range ratio while zooming.
Note: Using oxyplot on Xamarin.Android

 digital plot
Hello.
I'd like to plot several series of digital signals waveforms.
I'd like to find some examples regarding this item.
Thanks in advance

 Custom series - Error in XAML: The following type was expected: "Series"
I've tried to create my own series, based on the HighLowSeries. I wanted a chart where I could simply plot min, max and avg values for each point, like this:
My class inherits XYAxisSeries. Yet I cannot add it to the series in my control, "Invalid type: expected types are 'Collection<Series>' or 'Series', actual type is 'MinMaxAverageSeries'."
If I try to add the series to a PlotModel in code, it works.
My XAML:
<oxy:Plot Grid.Row="1">
<oxy:Plot.Series >
<charting:MinMaxAverageSeries ItemsSource="{Binding Data}" />
</oxy:Plot.Series>
</oxy:Plot>
Also, is there a way to achieve a similar chart without creating my own series? I Looked at BoxPlotSeries, but it seemed to have a lot of additional stuff that didn't quite fit.

 Polar chart LineAnnotation
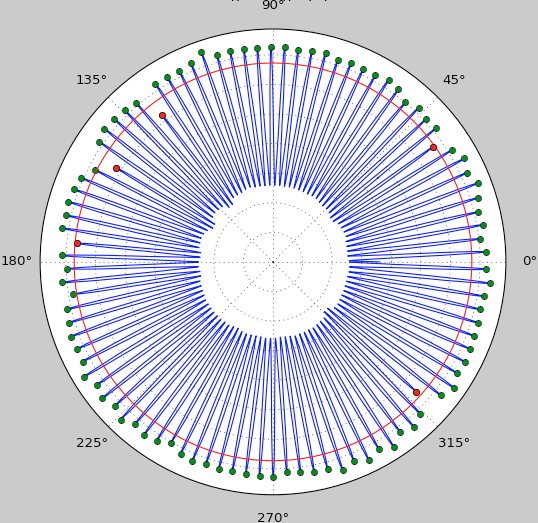
I'm attempting to add a LineAnnotation to a Polar PlotModel. My expectation is that it will appear on the plot as a line on the magnitude axis... Are annotations supported for polar plot models? I haven't found an example of this.
Example (matplotlib):


 How to Implement a PointCloudSeries for Large, Static Point Cloud Data
First off, Oxyplot is an amazing project - open source, high quality, MIT, tons of samples, even documentation :-) It covers many interesting use cases for me, but I hit one particular problem:
In WPF the pan/zoom performance is bad on large data sets (e.g. ScatterSeries with 100000 points). This is expected, of course, because of the rich interactiveness a ScatterSeries provides; no criticism. I experimented with various settings, also checking the performance guidelines (ScatterSeries, MarkerType=crosses seems to be best currently), but the result was not sufficient.
Use Case
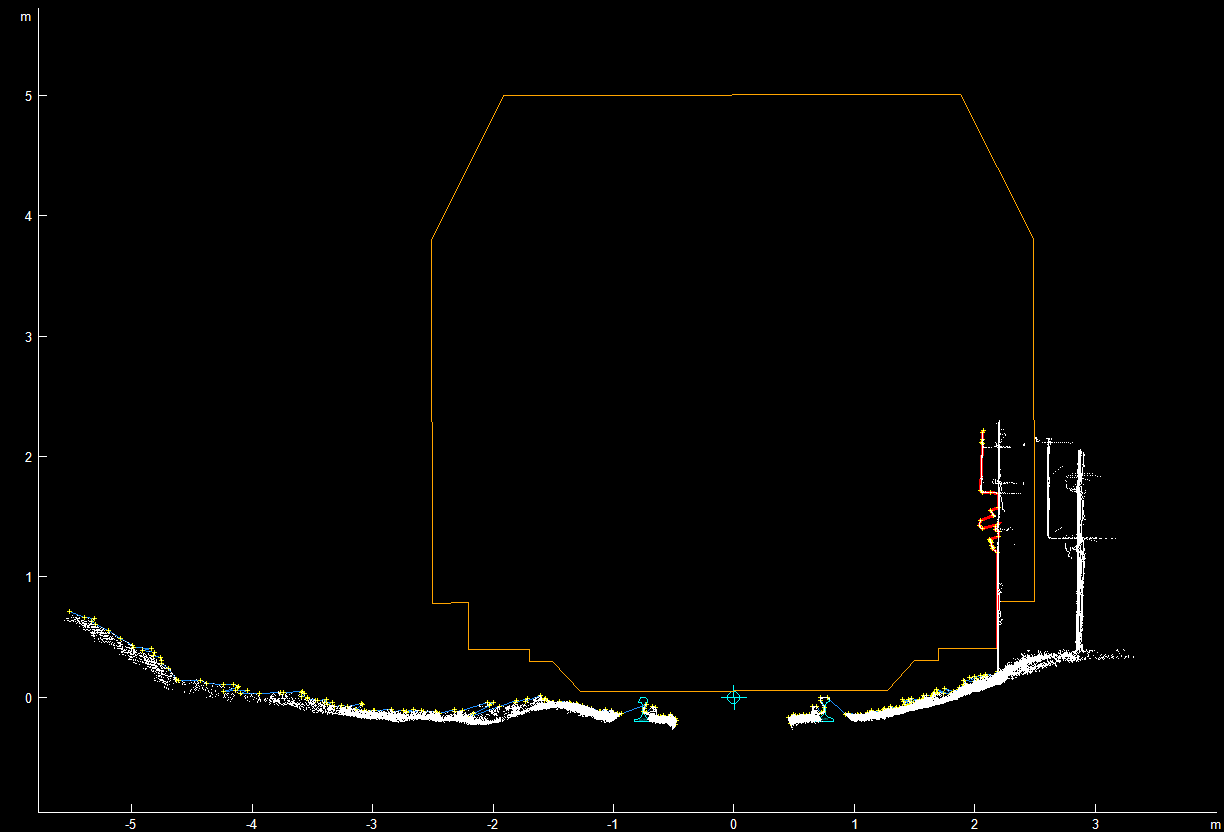
In the following screenshot you see
- White dots: about 90000 points from a laser scan
- Various line drawings on top

Goal
Implement a high performance oxyplot "Series" for large point clouds.
- The point cloud is static, initial loading time is less relevant
- A data point has x, y, color (or at least grayscale)
- The user can pan and zoom to investigate different areas - fast.
- Not sure about the tracker, yet.
Question
What's the best way to achieve this? Looking at the samples, I found that PolarHeatMapSeries has an image-based rendering mode, which allows for fast pan/zoom. There were some image annotations, too. Any directions are welcome. I'm willing to contribute, if it works out well.

 Panning, WinForm Keyboard arrow keys
davidt07 wrote at 2011-11-15 06:50:
Hi, in Silverlight examples it's possible to pan with arrow keys in WinForms? Also, are there shortcut keys for zooming in and out again for WinForms control?
Thank you very much, it's an awesome project :D
David
objo wrote at 2011-11-16 18:46:
you are right, arrow keys were not included in the WinForms control. But try the latest version 72355!
Use PgUp/PgDn or Add/Subtract/Plus/Minus keys to zoom. Use "Ctrl" for finer steps.
If you want to reverse the directions, change the sign on KeyboardPanHorizontalStep and KeyboardPanVerticalStep. These properties can also be changed if you want larger or smaller steps.
davidt07 wrote at 2011-11-17 02:53:
Thank you, I will take a look.
This project really is looking very good :D
thanks
David

 When trying to change data series: XAxis not defined.
Qwertie wrote at 2014-08-09 04:01:
PlotModels in advance, and whenever new data arrives, I call model.Series.Clear() and then re-add the Series again to show the new data.The first time the data is displayed, everything works fine. But after clearing and re-adding the series (without changing the
Axes or anything else), the following red error message appears (even if the new data series is identical to the old data series):OxyPlot paint exception: XAxis not defined.
Am I doing something wrong? How to fix?
P.S. how do you designate an axis as an X or Y axis? For example when I add a
CategoryAxis it becomes the X axis by default, but how could I make a
CategoryAxis that is a Y axis, or swap the X and Y axis?Qwertie wrote at 2014-08-09 19:13:
Position property e.g. Position = AxisPosition.Bottom)I notice that this is specifically a painting problem; if the graph is never painted on the screen (e.g. because it exists off-screen in a tab control) then I can clear the data series and repopulate it any number of times. The exception only occurs if the control is painted and then the data series are repopulated.
Edit: this is interesting, if I call
PngExporter.Export(...) then the png renders correctly. Not only that, but if I repaint the
OxyPlot.WindowsForms.PlotView after exporting, it draws properly again.P.S. Other than this problem, this library is fantastic! I love the various automatic features like fact that the graph automatically figures out the extents of the graph and that the data series automatically conforms to whatever Axis I add.

 Adding an element to a PlotModel
bsguedes wrote at 2013-03-05 15:17:
Is it possible to add custom elements to a PlotModel?
For instance, I would like to build a second Legend to a plot (it is not an annotation, since it should be fixed in the top corner, when I zoom or move the plot). This second legend could be a StackPanel, or a OxyRect, or a Grid maybe.
Thank you.
Bruno
objo wrote at 2013-03-13 21:29:
Annotation and override the Render method. You don't need to transform the rendered content by the axes, just use the
PlotModel.PlotArea property to find the coordinates. Note that annotations are not part of the measure/arrange methods for the 'plot area', so you need to set the plot margins manually if you want to place the second legend outside the plot area.wolf9s wrote at 2014-07-26 12:57:
Служба підтримки клієнтів працює на UserEcho


