
 Adjust ColumnSeries.ColumnWidth / CategoryAxis.IntervalLength
Hello,
I'm using the current version of Oxyplot.Silverlight. By the way, thx for this great library!
I have a CategoryAxis with 2 stacked column series. They can contain very few items (<10) or a lot of items(>50). The Plotview/x-axis should cover the whole available drawing area, but if there are less than 10 items, the columns get stretched which looks very ugly. Counterwise, if there are more than 50 values, the items are way too thin, so the labels overlap. I already used rotated labels with an angle of 90°.
I did not found a way to force the column width to a specified value without shortening the x-axis too. I already tried ColumnSeries.ColumnWidth and CategoryAxis.IntervalLength, but they didn't work out as expected.
Am I missing something?
Thx in advance for your help.

WPF tracker multiple value
Currently, I've two line series for one plot model. I want to know if it's possible to have a tracker with multiple value like this example :
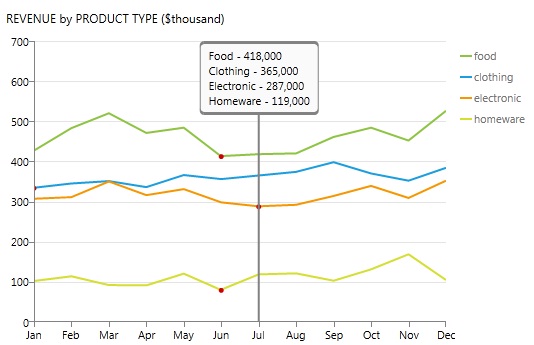
Best regards.

Axis label next to tickmarks

Heatmap with non equidistant values
Thanks,
Rainer

Rotate series labels.
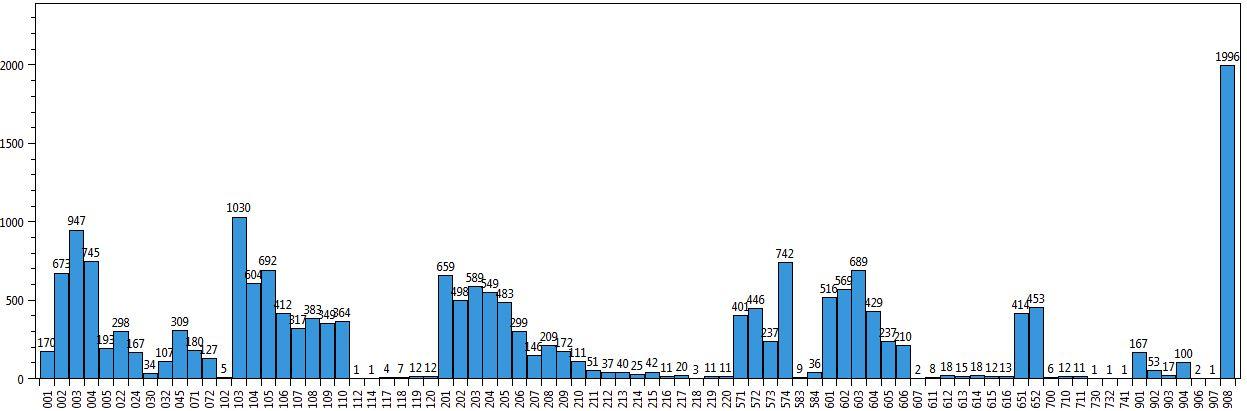
That's actually a demonstration of best-case scenario, where there's not a whole lot over spilling going on from labels... but if the graph is shrunk, labels begin to be cut-off. I was able to rate the category axis by setting its angle to -90 degrees, but I can't find any way to do the same thing with labels. I've looked through the source code, documentation and examples.

What should I use instead of LineSeries?

Areaseries: Fill area below baseline (realtime)
currently I'm implementing a realtime chart and so far I have the following:
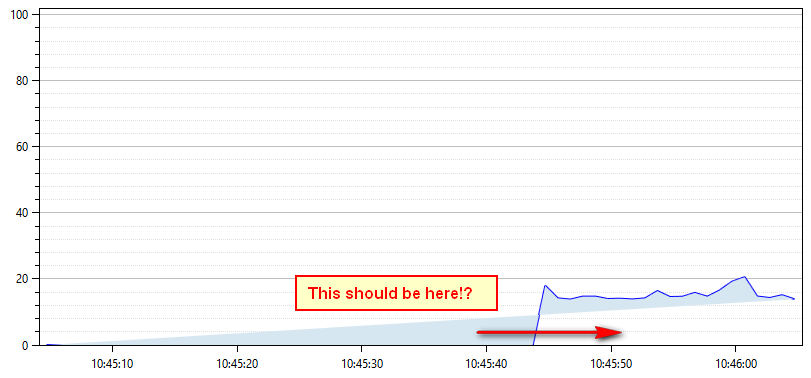
But I want something like this:
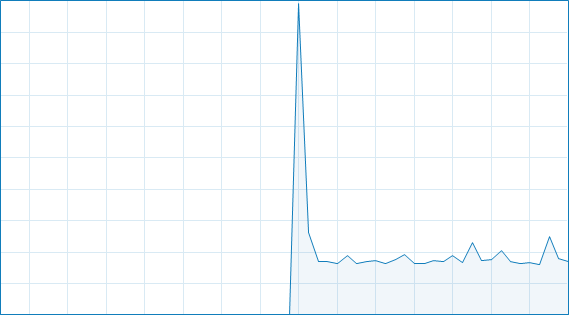
Any ideas how to achieve this? Here's the source code:
/// <summary>
/// Setup Plot
/// </summary>
private void SetupPlot()
{
    this.time = DateTime.Now;

    this.Plot = new PlotModel();

    this.Plot.Axes.Add(new LinearAxis()
                                    {
                                      IsZoomEnabled = false,
                                      Maximum = 102,
                                      Minimum=0,
                                      MajorGridlineStyle = LineStyle.Solid,
                                      MinorGridlineStyle = LineStyle.Dot,
                                      Position = AxisPosition.Left
                                    });

    this.Plot.Axes.Add(new DateTimeAxis()
                                    {
                                        IsZoomEnabled = false,
                                        Position = AxisPosition.Bottom,
                                    });

    var areaSeries = new AreaSeries()
    {
        StrokeThickness = 2,
        LineStyle = OxyPlot.LineStyle.Solid,
        Color = OxyColors.Blue,
        Color2 = OxyColors.Transparent,
        Fill = OxyColor.FromRgb(214, 231, 242),
        DataFieldX2 = "X",
        ConstantY2 = 0
    };

    // Fill series with initial values
    for (int i = 0; i < 60; i++)
    {
        areaSeries.Points.Add(new DataPoint(DateTimeAxis.ToDouble(time.Subtract(new TimeSpan(0, 0, 60 - i))), 0));
    }

    this.Plot.Series.Add(areaSeries);
}
Update of the Plot (every second):void timer_Tick(object sender, EventArgs e)
{
var areaSeries = (AreaSeries)this.Plot.Series[0];
if (areaSeries.Points.Count > 60)
{
areaSeries.Points.RemoveAt(0);
}
// Update-Plot
double percentage = GetPercentage();
areaSeries.Points.Add(new DataPoint(DateTimeAxis.ToDouble(this.time), percentage));
time = time.AddSeconds(1);
this.Plot.InvalidatePlot(true);
}Many Thanks!
LineSeries visibility in wpf Crash if not visible
This is all certainly easy enough to do, however, I have found that if the Visibility property is set to Collapsed, datapoints are added to the observable collection, then the Visibility property is set to Visible, a null reference exception is thrown from LineSeries.Render where the code tests actualPoints.Count. It would appear that adding points to a bound observable collection when the LineSeries is not visible, and then changing visibility does not properly update the internal data point collection.
If, however, the visibility property is set to Visible when the observable collection is changed, I can then set the visibility property to anything I want, and all works fine.
Is this a bug?
I can work around this by setting some sort of "AllSeriesInitialized" flag, that keeps all of the series visible until they are all initialized, but it seems that the currently exhibited behavior is not ideal, IMHO.
Thanks.

Render a part of a series.
I'm using OxyPlot 2014.1.546.0 in a WPF project. I've 10 stairstep series with each ~11000 Points.
To increase performance I want to render only every nth point depending of the zoom?
Eg: Render every 10th point if I see the whole x-Axis and render every 5th point if I see the half of the x-Axis, and so on?
Thanks for your help in advance.
Best regards
Christian
Individual column/bar selection.
I have a requirement of being able to select individual columns in a column chart to access related data; however, none of my attempts at handling selection changed or mouse down produced any viable results. SelectionChanged event doesn't even fire for me and no visible selection happens. SelectionColor for the model does not appear to do anything and SelectionMode doesn't produce any visible behavior with selection enabled in the ColumnSeries.
Сервис поддержки клиентов работает на платформе UserEcho

