 how can oxyplot layer render and simple layout
ProCodeMyth wrote at 2013-05-20 01:55:
thanks
objo wrote at 2013-06-08 10:05:
Yes, it should be possible to get better performance by just updating the invalidated visuals. But in the worst case, a single change in a series or axis may cause everything to be invalidated. I think a fair amount of code is required to keep track of all this (it is easy for the special case where the axes and size of the view is fixed, but not for the general case, I think).
It should be possible to add an "Invalidate" method on the series, but then I think the application should be responsible for the invalidation.
I am trying to keep the core of this library as simple as possible (which seems to always be in conflict with features and performance), and I am worried that this kind of change will make the code base more complicated. It will also be more work to implement this on the immediate mode platforms.
I am not sure what you mean about 'layout' here - is this about arranging multiple plots within the same view area?
objo wrote at 2013-06-08 11:26:

 Input string was not in a correct format
I am using OxyPlot.WIndowsUniversal 2014.1.546.0 in a win8.1 project. I am trying to create a chart witth a category axis, a linear axis and a line series. However in the drawing space of the chart I am getting the following error.
OxyPlot exception: Input string was not in a correct format.
Stack trace:
An exception of tpy[e System.FormatException was thrown when updating the plot model.
at System.Number.ParseDouble(String value, NumberStyles options, NumberFormatInfo numfmt)
at System.String.System.IConvertible.ToDouble(IFormatProvider provider)
at System.Convert.ToDouble(Object value)
at OxyPlot.Axes.Axis.ToDouble(Object value)
at OxyPlot.ReflectionExtensions.AddRange(List'1 target, IEnumerable itemsSource, String dataFieldX, String dataFieldY)
at OxyPlot.Series.DataPointSeries.UpdateItemsSourcePoints()
at OxyPlot.Series.DataPointSeries.UpdateData()
at OxyPlot.PlotModel.OxyPlot.IPlotModel.Update(Boolean updateData)
My code is this:
var chartModel = new PlotModel();
CategoryAxis categAxis = new CategoryAxis(); categAxis.Position = AxisPosition.Bottom;
 categAxis.ItemsSource = chartvm.DateValues;
 categAxis.LabelField = "MN";
 chartModel.Axes.Add(categAxis);
 LinearAxis linAxis = new LinearAxis();
 linAxis.Position = AxisPosition.Left;
chartModel.Axes.Add(linAxis);
var series = new LineSeries
{
 Color = OxyColor.FromArgb(255, 78, 154, 6),
 DataFieldX = "MN",
 DataFieldY = "Value",
 ItemsSource = chartvm.DateValues
 };
 chartModel.Series.Add(series);
plotView.Model = chartModel;
DateValues is an ObservableCollection of type DateValue and DateValue is defined below.
 public DateValue(DateTime dateTime, double value, string monthName, bool isFiller) {
 _Date = dateTime;
 _Value = value;
 _mn = monthName;
 _isFiller = isFiller;
 }
 private DateTime _Date;
 public DateTime Date
 {
 get { return _Date; }
 set { _Date = value; }
 }
 private double _Value;
 public double Value
 {
 get { return _Value; }
 set { _Value = value; }
 }
 private string _mn;
 public string MN
 {
 get { return _mn; }
 set { _mn = value; }
 }
 private bool _isFiller;
 public bool IsFiller
 {
 get { return _isFiller; }
 set { _isFiller = value; }
 }
I can't understand why i'm getting the error. I have verified that the data is correct since it is displayed in a list next to the chart.
Thanks in advance for any help. It will be really appreciated.

 WPF version line series thickness
sharethl wrote at 2014-07-02 22:19:
Set stroke thickness to 1 do not work.

Thanks
objo wrote at 2014-07-10 14:09:
sharethl wrote at 2014-08-04 21:40:
But I found thickness = 2 works really well. At first I thought default thickness is 1, but actually not.
Thanks


 Where to start in the code?
choden wrote at 2014-04-16 21:27:
I was looking to email objo, but I guess others might also be interested, so I am start a "discussion" about it.
I think Oxyplot is great and I'd love to contribute to it in the longer term. I downloaded the source code a few days back and started looking through it, but have a hard time finding a place to start reading code. I'm used to starting projects from scratch, or having a more "guided" type of development.
Could you please suggest good places to start in the code to get a general understanding of how OxyPlot works?

 Can the labels on the x-axis be changed?
drj1000 wrote at 2013-01-27 16:12:
Is there an easy way to change the labels on the x axis
I want to use should dates 12/15/2012 and so on or are there any alternatives?
thanks
Jerry
objo wrote at 2013-02-10 23:11:
Try setting
yourAxis.StringFormat="MM/dd/yyyy"; In OxyPlot you can also use
w and ww for week numbers. Also note the Culture property in the PlotModel. If Culture is not set, CultureInfo.CurrentCulture is used.

 2013.1.80.1 crash problem
sunwayking wrote at 2013-09-07 10:46:
.Net Framewrok 4.5 x86 & x64
.Net Framewrok 4.0 x86 & x64
.Net Framewrok 4.0 Client Profile x86 & x64
发生了 System.Windows.Markup.XamlParseException
HResult=-2146233087
Message=未能加载文件或程序集“OxyPlot, Version=2013.1.80.1, Culture=neutral, PublicKeyToken=638079a8f0bd61e9”或它的某一个依赖项。找到的程序集清单定义与程序集引用不匹配。 (异常来自 HRESULT:0x80131040)
Source=PresentationFramework
LineNumber=0
LinePosition=0
StackTrace:
在 System.Windows.Markup.WpfXamlLoader.Load(XamlReader xamlReader, IXamlObjectWriterFactory writerFactory, Boolean skipJournaledProperties, Object rootObject, XamlObjectWriterSettings settings, Uri baseUri) HResult=-2146234304
Message=未能加载文件或程序集“OxyPlot, Version=2013.1.80.1, Culture=neutral, PublicKeyToken=638079a8f0bd61e9”或它的某一个依赖项。找到的程序集清单定义与程序集引用不匹配。 (异常来自 HRESULT:0x80131040)
Source=mscorlib
FileName=OxyPlot, Version=2013.1.80.1, Culture=neutral, PublicKeyToken=638079a8f0bd61e9
FusionLog==== 预绑定状态信息 ===日志: DisplayName = OxyPlot, Version=2013.1.80.1, Culture=neutral, PublicKeyToken=638079a8f0bd61e9
(Fully-specified)
日志: Appbase = file:///C:/Users/Vae Anchoret/Desktop/Pipeline Security Pre-warning System_3进程版/Release/
日志: 初始 PrivatePath = NULL
调用程序集: OxyPlot.Wpf, Version=2013.1.80.1, Culture=neutral, PublicKeyToken=75e952ba404cdbb0。
日志: 此绑定从 default 加载上下文开始。日志: 正在使用应用程序配置文件: C:\Users\Vae Anchoret\Desktop\Pipeline Security Pre-warning System_3进程版\Release\ViewPluginTest.vshost.exe.Config
日志: 使用主机配置文件:
日志: 使用 C:\Windows\Microsoft.NET\Framework64\v4.0.30319\config\machine.config 的计算机配置文件。
日志: 策略后引用: OxyPlot, Version=2013.1.80.1, Culture=neutral, PublicKeyToken=638079a8f0bd61e9
日志: 尝试下载新的 URL file:///C:/Users/Vae Anchoret/Desktop/Pipeline Security Pre-warning System_3进程版/Release/OxyPlot.DLL。
警告: 比较程序集名称时发生不匹配: 生成号
错误: 未能完成程序集的安装(hr = 0x80131040)。探测终止。
   StackTrace:
        在 System.Reflection.RuntimeAssembly.GetType(RuntimeAssembly assembly, String name, Boolean throwOnError, Boolean ignoreCase, ObjectHandleOnStack type)
        在 System.Reflection.RuntimeAssembly.GetType(String name, Boolean throwOnError, Boolean ignoreCase)
        在 System.Windows.Baml2006.Baml2006SchemaContext.ResolveBamlTypeToType(BamlType bamlType)
        在 System.Windows.Baml2006.Baml2006SchemaContext.ResolveBamlType(BamlType bamlType, Int16 typeId)
        在 System.Windows.Baml2006.Baml2006SchemaContext.GetXamlType(Int16 typeId)
        在 System.Windows.Baml2006.Baml2006Reader.Process_ElementStart()
        在 System.Windows.Baml2006.Baml2006Reader.Process_OneBamlRecord()
        在 System.Windows.Baml2006.Baml2006Reader.Process_BamlRecords()
        在 System.Windows.Baml2006.Baml2006Reader.Read()
        在 System.Windows.Markup.WpfXamlLoader.TransformNodes(XamlReader xamlReader, XamlObjectWriter xamlWriter, Boolean onlyLoadOneNode, Boolean skipJournaledProperties, Boolean shouldPassLineNumberInfo, IXamlLineInfo xamlLineInfo, IXamlLineInfoConsumer xamlLineInfoConsumer, XamlContextStack`1 stack, IStyleConnector styleConnector)
        在 System.Windows.Markup.WpfXamlLoader.Load(XamlReader xamlReader, IXamlObjectWriterFactory writerFactory, Boolean skipJournaledProperties, Object rootObject, XamlObjectWriterSettings settings, Uri baseUri)
   InnerException:
objo wrote at 2013-09-07 15:56:
objo wrote at 2013-09-11 23:31:
sunwayking wrote at 2013-09-14 04:51:
This seems to be fixed now!That's great! I gonna have a try now.

 How to set size of part of plot control where graph is displayed?
funkerkat wrote at 2013-10-15 10:42:
objo wrote at 2013-10-15 15:04:
AutoAdjustPlotMargins to false! 
 Bug in PngDecoder.Decode
thomasdr wrote at 2013-11-14 14:00:
thomasdr wrote at 2013-11-14 14:23:
objo wrote at 2013-11-14 20:59:

 LineSeries not visible when y-axis reversed
mpdavison wrote at 2011-01-11 14:29:
I've been using OxyPlot for a few hours, and I've been very happy with how intuitive it is. Looking at the example projects, I see there is a plot which has its axes reversed. I have tried to plot LineSeries data such that the y-axis starts at 0 and proceeds downward to 700. When I do this, the y-axis is shown as intended, but the LineSeries doesn't get rendered. The method below renders the LineSeries fine when the StartPosition and EndPosistion are not specified. When they are specified, no lines are drawn. Is there something I'm missing?
private PlotModel GetPlot(Reel reel)
{
    var plotModel = new PlotModel();
    var offset = 1.0F;
    for (int i = 0; i < reel.TraceDataBlocks.Count; i += 3)
    {
        var series = new LineSeries("Trace " + i)
            {
                Color = OxyColors.Black,
                Title = i.ToString(),
                StrokeThickness = 0.5,
            };

        var y = 0F;
        var samples = reel.TraceDataBlocks[i].Samples.Take(750);
        var minX = samples.Min(s => s);
        var maxX = samples.Max(s => s);
        foreach (var sample in samples)
        {
            var normX = ((sample - minX) / (maxX - minX)) + offset;
            series.Points.Add(new DataPoint(normX, y++));
        }

        offset += 1F;
        plotModel.Series.Add(series);
    }

    plotModel.Axes.Add(new LinearAxis
    {
        Minimum =0,
        Maximum = 700,
        Position = AxisPosition.Left,
        StartPosition = 1,
        EndPosition = 0
    });
    plotModel.Axes.Add(new LinearAxis
    {
        Minimum = 0,
        Maximum = 50,
        Position = AxisPosition.Bottom,
    });
    return plotModel;
}
mpdavison wrote at 2011-01-11 22:00:
I had another look at the problem I'm having. I found that in OxyPlot.LineSeries.Render(...) where the clipping object is newed up there is no check to see if screen min/max values are reversed (as is the case when StartPosision = 1 and EndPosition = 0).
var clipping = new CohenSutherlandClipping(
    XAxis.ScreenMin.X, XAxis.ScreenMax.X,
    YAxis.ScreenMin.Y, YAxis.ScreenMax.Y);
Adding in a check and swapping the min/max values around fixed the issue. Is this the appropriate way to make this go? The modification:
double yMin, yMax, xMin, xMax;
if (YAxis.ScreenMax.Y > YAxis.ScreenMin.Y)
{
    yMin = YAxis.ScreenMin.Y;
    yMax = YAxis.ScreenMax.Y;
}
else
{
    yMin = YAxis.ScreenMax.Y;
    yMax = YAxis.ScreenMin.Y;
}
if (XAxis.ScreenMax.X > XAxis.ScreenMin.X)
{
    xMin = XAxis.ScreenMin.X;
    xMax = XAxis.ScreenMax.X;
}
else
{
    xMin = XAxis.ScreenMax.X;
    xMax = XAxis.ScreenMin.X;
}

var clipping = new CohenSutherlandClipping(xMin, xMax, yMin, yMax);
objo wrote at 2011-01-11 23:09:
thanks for reporting the bug. Yes, your solution is right - the clipping rectangle was not defined properly.
The bug is corrected in changelist 62017.
mdavison wrote at 2011-01-27 05:49:
Looks like changeset 62484 reintroduced this bug. Change beginning on line 139 below fixes it:
var minX = Math.Min(XAxis.ScreenMin.X, XAxis.ScreenMax.X);
var minY = Math.Min(YAxis.ScreenMin.Y, YAxis.ScreenMax.Y);
var maxX = Math.Max(XAxis.ScreenMin.X, XAxis.ScreenMax.X);
var maxY = Math.Max(YAxis.ScreenMin.Y, YAxis.ScreenMax.Y);

var clippingRect = new OxyRect(
    minX,
    minY,
    maxX - minX,
    maxY - minY);
objo wrote at 2011-01-27 06:16:
thanks! not sure how that happened... I have checked in the fix!

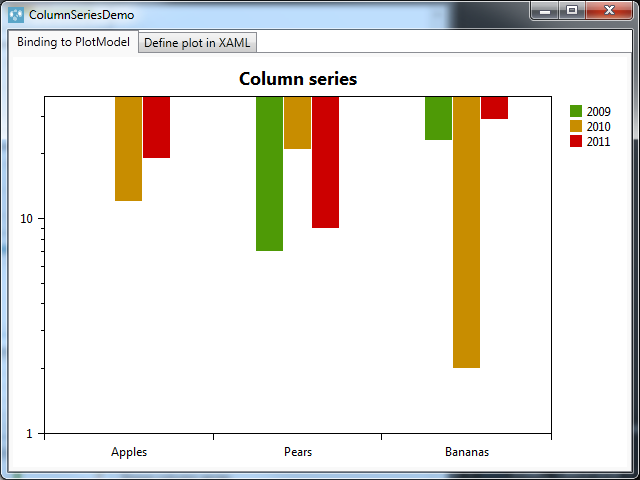
 Colum items not rendered properly when using a logarithmic Y axis
Please see the following discussion: http://discussion.oxyplot.org/topic/1041241-/

In the class ColumnSeriesDemo.MainWindow, I changed the lines 43 and 44 from
To
tmp.Axes.Add(new CategoryAxis { Position = AxisPosition.Bottom, ItemsSource = this.Items, LabelField = "Label" });
tmp.Axes.Add(new LogarithmicAxis { Position = AxisPosition.Left, Minimum = 1, Base = 10 });

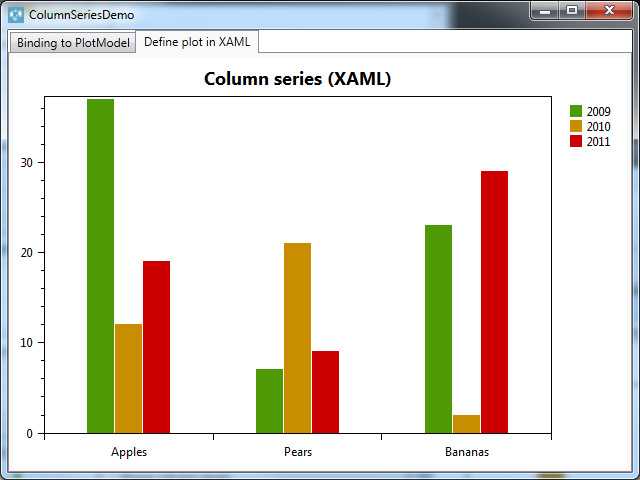
With xaml, without the log Y axis:

Служба підтримки клієнтів працює на UserEcho

