
 Can't set column widths on Reporting.ItemsTable
nutsontheroad wrote at 2013-11-26 10:45:
I figured I need to do something like the code below but the column widths seem to be ignored.
Any help would be much appreciated.
    class Item {
        public string ColumnA { get; set; }
        public string ColumnB { get; set; }
    }

    class Program
    {
        static void Main(string[] args)
        {
            Report theReport = new Report();
            theReport.Title = "My Test Report";

            ItemsTable theTable = new ItemsTable();

            ItemsTableField thisColumn = new ItemsTableField("Column A", "ColumnA");
            thisColumn.Width = 200.0;
            theTable.Fields.Add(thisColumn);

            thisColumn = new ItemsTableField("Column B", "ColumnB");
            thisColumn.Width = 50.0;
            theTable.Fields.Add(thisColumn);

            theTable.Items = new List<Item>() {
                new Item() {ColumnA = "This", ColumnB = "Is"},
                new Item() {ColumnA = "A", ColumnB = "Test"},
                new Item() {ColumnA = "Longer string that I don't want to", ColumnB = "wrap"},
            };

            theReport.Add(theTable);

            using (PdfReportWriter writer = new PdfReportWriter(@"d:\temp\out.pdf"))
            {
                writer.WriteReport(theReport, new ReportStyle());
            }
        }
    }
delapiero wrote at 2014-03-06 12:47:
nutsontheroad wrote at 2014-03-06 13:17:
slashdevnull wrote at 2014-03-10 12:27:
nutsontheroad wrote at 2014-03-10 14:07:
Zooming and panning on all axes
anomistu wrote at 2011-11-03 12:31:
Hi
Currently, when interacting within the plot area, only the first horizontal and vertical axis in the axes collection are used by the manipulators.
Wouldn't it make sense to apply these transformations to all axes that have them enabled (like on PageUp/PageDown)? Is this something you would consider in a future release?
Thank you
objo wrote at 2011-11-03 23:07:
yes, I have considered this - and it is probably not a big job to implement, will do it later.
Both arrow keys and mouse panning inside the plot area should change all axes. You still have the option of changing a single axis by panning in the axis area.
heromyth wrote at 2011-11-11 08:45:
Maybe, grouping the axes can make thinghs easier.
anomistu wrote at 2011-11-23 11:58:
heromyth wrote:
Maybe, grouping the axes can make thinghs easier.
What exactly do you mean by "grouping"?
Any news on this, objo? Unfortunately, this seems to be the first thing users complain about when they try out my oxyplot implementation. They're baffled by the fact that they only control one y-axis from the plot area.
Force refresh of axis
DennisLer wrote at 2014-07-31 11:07:
I'm having a problem with forcing refresh of the x-axis when it changes with time. I have a datetime axis as the x-axis. This should be updated approx. each hour with a new hourly timestamp to the right.
I'm currently setting the maximum and minimum and doing an invalidatePlot of the PlotModel, but this doesn't make the axis refresh. Tried it with data plotted in the plot and without any data plotted in the plot.
How can I make the axis update over time ?
DennisLer wrote at 2014-07-31 15:43:
Unexplained gap in histogram
MaskedBit wrote at 2014-05-07 21:23:
objo wrote at 2014-05-10 23:29:
Tracker Format for Custom data points
cz9qvh wrote at 2014-06-11 23:27:
Series = new ScatterSeries());
Series.TrackerFormatString = "match: {Match}";public class MyDataPoint : ScatterPoint {
public string Match {get;set;}
public MyDataPoint(double x, double y, string match):base(x,y) { Match = match; }
}Series.Points.Add(new MyDataPoint(5,10,"Message about this"));I thought I used the wrong TrackerFormatString so tried this one but it had the same result
Series.TrackerFormatString = "Match {DataPoint.Match}";mhedqvist1 wrote at 2014-06-13 12:59:
In previous projects I used IDataPoint, but that seems to be removed now..
cz9qvh wrote at 2014-06-16 16:23:
mhedqvist wrote at 2014-07-29 11:15:
In my XAML I added:
<oxy:PlotView ... >
                <oxy:PlotView.DefaultTrackerTemplate>
                    <ControlTemplate>
                        <oxy:TrackerControl Position="{Binding Position}" LineExtents="{Binding LineExtents}">
                            <oxy:TrackerControl.Content>
                                <TextBlock Text="{Binding}" Margin="8"/>
                            </oxy:TrackerControl.Content>
                        </oxy:TrackerControl>
                    </ControlTemplate>
                </oxy:PlotView.DefaultTrackerTemplate>
</oxy:PlotView> var scatterSeries = new ScatterSeries
{
...
TrackerFormatString = "{ToolTip}"
};
 public class ScatterPointWithToolTip : ScatterPoint
  {
    public string ToolTip { get; private set; }

    public ScatterPointWithToolTip(double x, double y, ...., object tooltip)
      : base(x, y...)
    {
      ToolTip = (string) tooltip;
    }
  }
 ArrowAnnotation.Text event
is it possible to get an event by clicking on the ArrowAnnotation.Text ???
Save as png
sanndeb wrote at 2011-11-23 05:51:
if you want to use save as png use the following
// todo: Use imagetools.codeplex.com
using ImageTools;
using ImageTools.IO;
using ImageTools.IO.Png;

public partial class Plot : Control, IPlotControl
{
//..............................
        public void SaveAsPng(SaveFileDialog dialog)
        {
            SaveToImage(dialog, new PngEncoder());
        }


        void SaveToImage(SaveFileDialog dialog, IImageEncoder encoder)
        {
            using (var stream = dialog.OpenFile())
            {
                var image = this.ToImage();
                encoder.Encode(image, stream);
            }
        }
//..............................
}

Similerly you can save as bmp etc as well....
objo wrote at 2011-11-23 06:40:
Yes, Imagetools seems to be a great solution for png export for Silverlight.
I will add an example showing how to use it, but don't think the reference should be added in the standard OxyPlot.Silverlight project.
Replacing numeric labels with text on linear axis
robjmberry wrote at 2014-02-05 13:16:
I would like to create a Bar chart that shows the progress of items through an established workflow.
For example: A made up order system has the following stages:
1) Credit check
2) Credit approved
3) Order dispatched
4) Order received
5) Order closed
What I’d like to do is have open orders listed vertically on a category axis and then bar the will show how far through the life-cycle the order is. Using a linear axis and the numerical value of the status this can be done easily. What I’d like is to replace the number on the axis with the stage, eg: 2 would be shown as Credit Approved
Is this possible ?
thanks,
rob
objo wrote at 2014-02-14 16:07:
Axis class and override the Axis.FormatValue method.public class MyLinearAxis : LinearAxis { public override string FormatValue(double x) { switch ((int)x) { case 1: return "Credit check"; // etc. default: return string.Empty; } } }
Func<double,string> property to the Axis class if this is a frequently needed feature. Something like this:public Func<double, string> LabelFormatter { get; set; } public virtual string FormatValue(double x) { if (this.LabelFormatter != null) { return this.LabelFormatter(x); }
- create an issue
- create a fork
- add some unit tests
- implement
- submit including issue #
- make a pull request.
Always displaying the tracker
Robert24 wrote at 2012-06-26 17:57:
I am interested in showing the tracker all the time, not just after a left mouse click when over a graphed item. Can this be added? If not can you point me in the right direction for the best way to implement this feature?
Thanks
objo wrote at 2012-06-27 14:51:
I added this in the issue tracker. See work item 9963!
Currently the tracker is 'following' the series that was nearest at the mouse down point. When it is shown all the time, it needs to 'jump' to the nearest series.
Implementation: I think both the Plot control class and the TrackerManipulator class must be changed. The tracker's Completed method should not hide tracker and not reset the 'current' series. I can look into this later.
Tech_Junkie wrote at 2012-07-19 11:15:
A hopefully smaller question, but very related.
What would be the best way to show a persistent line in the plot after clicking the graph? This line should be similar to one of the lines in the cross shown from the tracker when the plot is clicked. Just to indicate the clicked value on one of the axes.
Thanks in advance!
objo wrote at 2012-08-08 23:51:
Add an 'annotation'. Try to add a LineAnnotation to the Annotations collection of the PlotModel!
sharethl wrote at 2014-08-04 19:55:
In MouseEventExample -> Select range, I added a line annotation that always following the mouse, but PlotView cannot fire mouse events.
How come the annotation blocked mouse event from firing?
Note: WinForm works fine.
model.Annotations.Add(range);
var cursor = new LineAnnotation()
{
    Type = LineAnnotationType.Vertical,
    Color = OxyColors.Green,
    ClipByYAxis = false,
};
model.Annotations.Add(cursor);
........
model.MouseMove += (s, e) =>
{
cursor.X = cursor.InverseTransform(e.Position).X;
    if (!double.IsNaN(startx))
    {
        var x = range.InverseTransform(e.Position).X;
        range.MinimumX = Math.Min(x, startx);
        range.MaximumX = Math.Max(x, startx);
        range.Text = string.Format("∫ cos(x) dx =  {0:0.00}", Math.Sin(range.MaximumX) - Math.Sin(range.MinimumX));
        model.Subtitle = string.Format("Integrating from {0:0.00} to {1:0.00}", range.MinimumX, range.MaximumX);

        e.Handled = true;
    }
    model.InvalidatePlot(false);
};
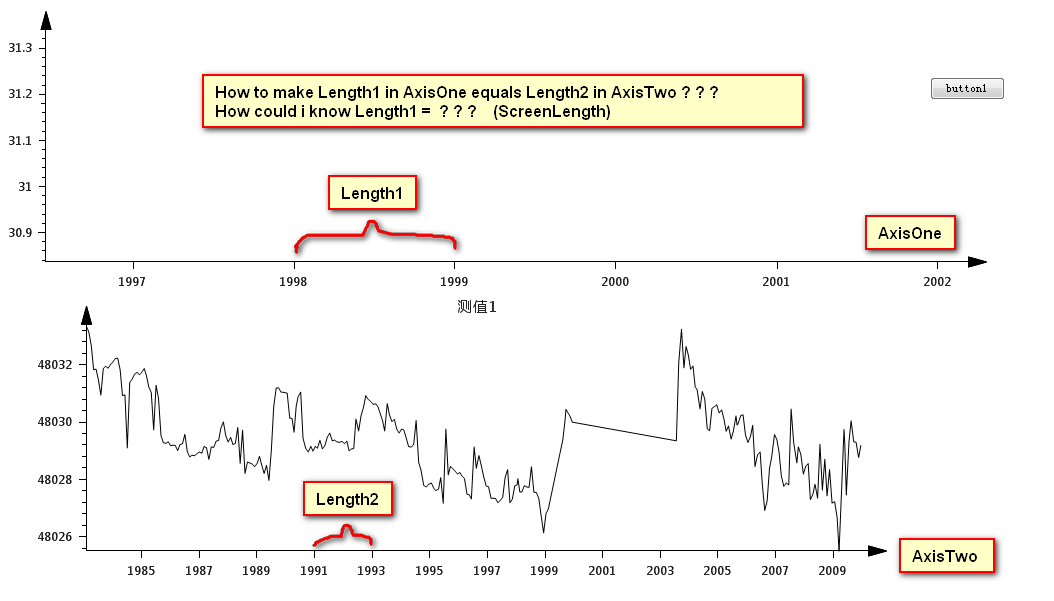
How to set the length of two ticks in DateTimeAxis ?
Customer support service by UserEcho
