
 Rectangle Bar Series Export PDF Bug
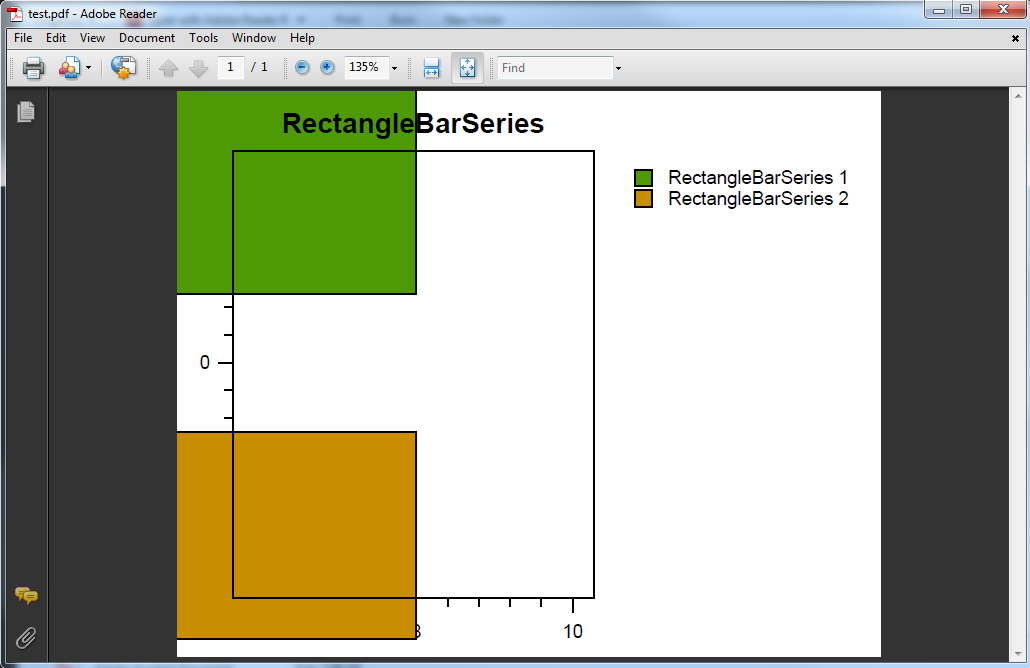
As you can see the bars render outside of the plot area. Was going to create an issue on github but wanted to check first that I'm not doing anything wrong.
Here is the codebase that can reproduce this:
public partial class Form1 : Form

 Xamarin - Blurry Graphs
benhysell wrote at 2014-02-24 19:06:
I am having a bit of an issue with the generated graphs, and maybe I'm missing something simple, but all of the graphs created on the simulator and on the devices appear blurry. See the attached screen shot:

Thoughts? Thanks!
objo wrote at 2014-02-24 22:00:
benhysell wrote at 2014-02-25 01:09:
Let me know if you need help with device testing.
objo wrote at 2014-02-25 08:12:
I am currently trying to fix the image rendering (having some issues on partial image drawing) and touch events (depends on https://oxyplot.codeplex.com/workitem/9625) on the iOS control.
objo wrote at 2014-02-27 22:37:
default. The new version should not be blurry, and should also render aliased (e.g. axis/grid lines) much nicer. Can you check this on your devices?
There are still some issues remaining on image drawing and text rendering (should use Core Text). Also the touch events are not handled (waiting for #9625 to be pulled in).
benhysell wrote at 2014-02-28 01:51:
default, and my graphs now look great using the new iOS control PlotView. The example app looks great, as well as my own app where I swapped out core-plot for Oxyplot.
As for hardware I tested with what I had on hand, a 5s and iPad3.
I ran Instruments against the iPad3 in debug mode, and was happy to see memory and CPU usage were both super low. As a comparison, doing the same exact work using core-plot on the iPad would either result in a soft reset because I consumed 300 MB of memory, or 100% CPU usage for a prolonged period of time while rendering three plots.
Did the Xamarin.Android project get the same treatment, or was this not a problem on the Android side?
objo wrote at 2014-02-28 07:18:
Point selection on Line series?
3Nu wrote at 2014-07-03 15:31:
First of all, thank you very much for this great chart library.
I'm having a problem while attempting to change the color of the selected marker in a line series. Is this possible at all, or it is a not-supported feature?
I've tried to modify the "LineSeries and PlotModel MouseDown event" example, simply adding the following lines
        model.SelectionColor = OxyColors.Red;
        s1.SelectionMode = SelectionMode.Single;
        s1.ItemsSource = s1.Points;
                // Check if we are near a point
                if ((nearestPoint - e.Position).Length < 10)
                {
                    // Start editing this point
                    indexOfPointToMove = indexOfNearestPoint;
                    s1.SelectItem(indexOfPointToMove);
                }
Last thing, why do we have to change the color at model level? Isn't more flexible doing it a series level? That is we could also have more control on the stroke of the selected item.
Thanks,
Fabio
Slxe wrote at 2014-07-03 17:00:
Also imo at least selection colour should be global to the model itself, not series. I can't really think of a reason you'd want multiple different selection colours unless you're selecting different items for different actions.
3Nu wrote at 2014-07-03 19:11:
If you see that the flag set properly. then, or it is ignored, or the color is overwritten when the line series get rendered, I imagine.
The reason was for aesthetics, as I might have 2 or more series on the same plot, and I might want to highlight each marker based on the original marker color, or with different colors for quick distinguish with a quick look. (I'm assuming here that you can have multiple items selected on the same plot from different series)
Anyway I solved it creating a scattered series that "clones" some information from the selected marker's series and paint a scattered item on top of it.
Thank you for the help.
Slxe wrote at 2014-07-03 22:32:
That sounds more like a use for highlighting, not selection, although I do agree, I think highlighting should be drawn around (probably harder than it sounds or based on the original colour). It does look a bit weird in the Toolbar example I put together when you change the colour of an annotation and it just remains shiny yellow, would be nice to have it based on the colour it is, as you mention.
WPF VB.NET application
Morisse wrote at 2013-08-15 10:11:
Thank for your free code. It's seem to be very beautiful.
I've to make an application for an hydraulic bench. It's write under vb.net 2012 WPF.
I've not found any example under vb.net.
I try this :
xaml.vb
Private Sub Window_SourceInitialized_1(sender As Object, e As EventArgs)
    Dim Mesures As New ObservableCollection(Of Mesure)

    For j As Integer = 0 To 25
        Dim Mes As New Mesure
        Mes.Temps = 10 * j
        Mes.Value = 2 * j
        Mes.Maximum = 2 * j + 1
        Mes.Maximum = 2 * j - 1
        Mesures.Add(Mes)
    Next j

    Courb.DataContext = Mesures
End Sub
<Window x:Class="Fene_Courbe"
xmlns="http://schemas.microsoft.com/winfx/2006/xaml/presentation"
xmlns:x="http://schemas.microsoft.com/winfx/2006/xaml"
    xmlns:oxy="clr-namespace:OxyPlot.Wpf;assembly=OxyPlot.Wpf"
      Title="COURBES" Height="600" Width="800" Closing="Window_Closing_1" Topmost="True" SourceInitialized="Window_SourceInitialized_1" ContentRendered="Window_ContentRendered_1">

    <Grid>
    <oxy:Plot x:Name="Courb" Title="Courbes" LegendPlacement="Outside" LegendPosition="RightTop" LegendOrientation="Vertical">
        <oxy:Plot.Series>
            <oxy:LineSeries x:Name="CPR1" DataContext="Mesures" Title="PR1"  DataFieldX="Temps" DataFieldY="Value"  ItemsSource="{Binding Items}" StrokeThickness="2" Color="Red" ></oxy:LineSeries>
            <oxy:LineSeries x:Name="CMax" DataContext="Mesures"  Title="Max"  DataFieldX="Temps" DataFieldY="Maximum"  ItemsSource="{Binding Items}" StrokeThickness="2"  Color="Green" ></oxy:LineSeries>
            <oxy:LineSeries x:Name="CMin" DataContext="Mesures"  Title="Min"  DataFieldX="Temps" DataFieldY="Minimum"  ItemsSource="{Binding Items}" StrokeThickness="2"  Color="Violet" ></oxy:LineSeries>
        </oxy:Plot.Series>
    </oxy:Plot>
</Grid>I have a frame with axis and legends for the 3 curves, but no curve.
1- Is anyone can help me ?
2- Can i use also data from a dataset ?
3- Where can i find an vb.net WPF example ?
Thanks by advance
Laurent
objo wrote at 2013-08-15 16:41:
I have not tried with a DataSet yet, but it would be interesting to see if that works! Will add an example (in C#) later.
Morisse wrote at 2013-08-15 19:42:
i continue my tries...
Laurent
Morisse wrote at 2013-08-19 15:56:
I give you my vb code
Public Class Mesure
    Implements INotifyPropertyChanged

    Private _Temps As Double
    Private _Mesure1 As Double
    Private _Mesure2 As Double
    Private _Mesure3 As Double

    Public Sub New()
        _Temps = 0.0
        _Mesure1 = 0.0
        _Mesure2 = 0.0
        _Mesure3 = 0.0
    End Sub

    Public Overrides Function ToString() As String
        Return Format(_Temps, "{0:##0.00}") & " " & Format(_Mesure1, "{1:# ##0.00}") & " " & Format(_Mesure2, "{2:# ##0.00}") & " " & Format(_Mesure3, "{3:# ##0.00}")
    End Function

    Private Sub NotifyPropertyChanged(<CallerMemberName()> Optional ByVal propertyName As String = Nothing)
        RaiseEvent PropertyChanged(Me, New PropertyChangedEventArgs(propertyName))
    End Sub

    Public Property Temps() As Double
        Get
            Return _Temps
        End Get

        Set(ByVal value As Double)
            _Temps = value
            NotifyPropertyChanged()
        End Set
    End Property
    Public Property Mesure1() As Double
        Get
            Return _Mesure1
        End Get

        Set(ByVal value As Double)
            _Mesure1 = value
            NotifyPropertyChanged()
        End Set
    End Property
    Public Property Mesure2() As Double
        Get
            Return _Mesure2
        End Get

        Set(ByVal value As Double)
            _Mesure2 = value
            NotifyPropertyChanged()
        End Set
    End Property
    Public Property Mesure3() As Double
        Get
            Return _Mesure3
        End Get

        Set(ByVal value As Double)
            _Mesure3 = value
            NotifyPropertyChanged()
        End Set
    End Property

    Public Event PropertyChanged(sender As Object, e As PropertyChangedEventArgs) Implements INotifyPropertyChanged.PropertyChanged
End Class
  Public Mesures As New Collection(Of Mesure)


.....
  For k As Double = 0 To 1 Step 0.00001
    Mesures.Add(New Mesure With {.Temps = k, .Mesure1 = Sin(15 * k) * 500, .Mesure2 = Cos(10 * k) * 250, .Mesure3 = Sin(8 * k) * 100)
  Next k
......
<Window x:Class="Fene_Courbe"
xmlns="http://schemas.microsoft.com/winfx/2006/xaml/presentation"
xmlns:x="http://schemas.microsoft.com/winfx/2006/xaml"
Title="COURBES" Height="600" Width="800" Closing="Window_Closing_1" Topmost="True"
    xmlns:oxy="clr-namespace:OxyPlot;assembly=OxyPlot"
    xmlns:oxywpf="clr-namespace:OxyPlot.Wpf;assembly=OxyPlot.Wpf" SourceInitialized="Window_SourceInitialized_1">
<Grid>
    <oxywpf:Plot x:Name="Courbes" Title="Courbes" Background="Beige">
        <oxywpf:LineSeries x:Name="PR1" Color="Red" Title="PR1" DataFieldX="Temps" DataFieldY="Mesure1" ItemsSource="{Binding Mesures}" ></oxywpf:LineSeries>
        <oxywpf:LineSeries x:Name="PR2" Color="Blue"  Title="PR2" DataFieldX="Temps" DataFieldY="Mesure2" ItemsSource="{Binding Mesures}" ></oxywpf:LineSeries>
        <oxywpf:LineSeries x:Name="DB1" Color="Green"  Title="DB1" DataFieldX="Temps" DataFieldY="Mesure3" ItemsSource="{Binding Mesures}" ></oxywpf:LineSeries>
    </oxywpf:Plot>
</Grid>Fene_Courbe.xaml.vb
Imports OxyPlot
Imports OxyPlot.Series
Imports System.Collections
Imports System.Collections.Generic
Imports System.Linq
Imports System.Windows
Imports System.Windows.Controls
Imports System.Windows.Data
Imports System.Windows.Documents
Imports System.Windows.Input
Imports System.Windows.Media
Imports System.Windows.Media.Imaging
Imports System.Windows.Navigation
Imports System.Windows.Shapes
Public Class Fene_Courbe
Private Sub Window_SourceInitialized_1(sender As Object, e As EventArgs)
    Courbes.Series().Item(0).ItemsSource = Mesures
    Courbes.Series().Item(1).ItemsSource = Mesures
    Courbes.Series().Item(2).ItemsSource = Mesures
End Sub
Misbehavior in PlotType.Cartesian
amity2001 wrote at 2013-03-27 07:40:
I have observe a misbehavior when I set
PlotType = PlotType.Cartesian
When my application re-sizes reducing it's size, the plot also re size with proper proportion.
But when the application re-sizes increasing it's size, the plot re size itself but keeps proportion as it is.
Kindly let me know how can I avoid this issue.
Thanks.
How about IPlotElement interface and more interfaces like ILinePen etc.
heromyth wrote at 2011-08-26 04:26:
All the PlotElement can be rendered on the plot. It's not always relative to the axis. So, I defined it as this:
public interface IPlotElement
{
bool IsVisible { get; set; }
/// <summary>
/// The border box
/// </summary>
OxyRect ScreenRect { get; }
OxyRect GetScreenRectangle(IRenderContext rc);
void Render(IRenderContext rc, PlotModel model);
OxyThickness Margin { get; }
OxyThickness Padding { get; }
}
The PlotAreaBorderBox, PlotLegend, ChartBorderBox, and any custom PlotElement which needs to stay on the Plot, etc. can using it.
For example:
Index: OxyPlot/PlotModel/PlotModel.Rendering.cs
===================================================================
--- OxyPlot/PlotModel/PlotModel.Rendering.cs (revision 69705)
+++ OxyPlot/PlotModel/PlotModel.Rendering.cs (working copy)
@@ -23,15 +23,41 @@
UpdateAxisTransforms();
RenderBackgrounds(rc);
RenderAxes(rc);
+ RenderChartPane(rc);
RenderAnnotations(rc, AnnotationLayer.BelowSeries);
RenderSeries(rc);
RenderAnnotations(rc, AnnotationLayer.OverSeries);
RenderTitle(rc);
RenderBox(rc);
+ RenderCustomPlotObject(rc);
if (IsLegendVisible)
RenderLegends(rc, LegendArea);
}
private void RenderCustomPlotObject(IRenderContext rc)
{
foreach (IPlotElement pe in CustomPlotObjects)
{
if (!pe.IsVisible)
continue;
pe.Render(rc, this);
}
}
=================
By the way, is it better to abstract all the propertied like MajorGridlineColor, MajorGridlineStyle, MajorGridlineThickness into an property (like MajorTickline or MajorTicklinePen which implements the pen interface like ILinePen)?
So, we may have these properties:
public ILinePen Axisline { get; set; }
public ILinePen MajorGridline { get; set; }
public ILinePen MinorGridline { get; set; }
public ILinePen ExtraGridline { get; set; }
public TickLinePen MajorTickline { get; set; }
public TickLinePen MinorTickline { get; set; }
Here is the ILinePen:
public interface ILinePen
{
OxyColor Color { get; set; }
LineStyle Style { get; set; }
double Thickness { get; set; }
OxyPenLineJoin Join { get; set; }
double[] DashArray { get; }
bool IsVisibale { get; }
}
and some pens:
public class OxyLinePen : ILinePen {}
public class TickLinePen : OxyLinePen {}
If it's valuable, I can submit these patches.
objo wrote at 2011-08-28 21:45:
thanks for review of the code!
PlotElements: I am not sure if I understand correctly - I see some similarities with the Annotations (which can be placed anywhere on the plot, and may or may not be using axes). Are you thinking that the plot elements should be measured and arranged? Or is it an abstraction for elements that have a border?
Pen: There is already an OxyPen, but I decided to use it only internally, not in the API. I see the advantage with reduced number of properties (particularly in the Axis classes), but wanted to follow the conventions from the WPF API - like System.Windows.Shapes.Path where you have properties for Stroke, StrokeThickness, StrokeDashArray etc. We could add this as an issue in the issue tracker, but I would wait to implement it until there are some positive votes. Here is an example how XAML would look like if you want to change the color of the major grid lines to blue (I know it can be shorter by markup extensions or linking to a resource):
<oxy:LinearAxis>
  <oxy:LinearAxis.MajorGridline>
    <oxy:OxyPen Color="Blue"/>
  </oxy:LinearAxis.MajorGridline>
</oxy:LinearAxis>
vs. how it is today:
<oxy:LinearAxis MajorGridlineColor="Blue"/>
heromyth wrote at 2011-08-29 02:50:
objo wrote:
thanks for review of the code!
PlotElements: I am not sure if I understand correctly - I see some similarities with the Annotations (which can be placed anywhere on the plot, and may or may not be using axes). Are you thinking that the plot elements should be measured and arranged? Or is it an abstraction for elements that have a border?
Yes, they are alike. I had thought the Annotations must be using axes. I just use PlotElements to render some box around some sub-area. I should take a deep look the Annotations.
Pen: There is already an OxyPen, but I decided to use it only internally, not in the API. I see the advantage with reduced number of properties (particularly in the Axis classes), but wanted to follow the conventions from the WPF API - like System.Windows.Shapes.Path where you have properties for Stroke, StrokeThickness, StrokeDashArray etc. We could add this as an issue in the issue tracker, but I would wait to implement it until there are some positive votes. Here is an example how XAML would look like if you want to change the color of the major grid lines to blue (I know it can be shorter by markup extensions or linking to a resource):
<oxy:LinearAxis>
  <oxy:LinearAxis.MajorGridline>
    <oxy:OxyPen Color="Blue"/>
  </oxy:LinearAxis.MajorGridline>
</oxy:LinearAxis>
vs. how it is today:
<oxy:LinearAxis MajorGridlineColor="Blue"/>
Waiting for somebody to say something.
Is it possible to bind to an Axis?
_Noctis_ wrote at 2013-11-05 14:29:
Adding axes in XAML
<oxy:Plot Title="Linear axes">
    <oxy:Plot.Axes>
        <oxy:LinearAxis Position="Bottom" Minimum="-20" Maximum="80" />
        <oxy:LinearAxis Position="Left" Minimum="-10" Maximum="10" />
     </oxy:Plot.Axes>
</oxy:Plot>

Adding axes to a PlotModel
var model=new PlotModel();
model.Axes.Add(new LinearAxis(AxisPosition.Bottom,-20,80));
model.Axes.Add(new LinearAxis(AxisPosition.Left,-10,10));more to the point, the reason was I wanted to see if I can make two charts share an axis, so moving one will move the other ...
Ideas? Suggestions?
objo wrote at 2013-11-06 23:13:
ActualMinimum and
ActualMaximum dependency properties (one-way). https://oxyplot.codeplex.com/workitem/10096
In the current implementation, you can subscribe to the AxisChanged event on the axis (not yet available on the Wpf.Axis class), read the ActualMinimum and ActualMaximum and use the Zoom(x0,x1) method to set the range on the other axis.
The AxisChanged routed event is registered at
https://oxyplot.codeplex.com/workitem/9992
Also remember to invalidate the plot every time the values are changed.
GetClippingRect fails due to XAxis and YAxis being null
dvkwong wrote at 2011-11-23 08:49:
I am writing a render context using MonoTouch for IOS and I having trouble with rendering
var plot = ExampleLibrary.BarSeriesExamples.SimpleBarSeries();
I get an exception in the GetClippingRect method trying to acces XAxis and YAxis which are both null.
How do I go about setting these properties?
I am able use the below example and this works ok-ish
var plot = ExampleLibrary.PieSeriesExamples.LinearAxes();
Thanks
David
BTW: When I am done I will contribute the code back to you.
objo wrote at 2011-11-23 09:06:
cool to hear that you are working on a MonoTouch implementation!
Remember to call PlotModel.Update(true) to prepare the plot for rendering. This method will set the axes for the BarSeries.
After update, you can call PlotModel.Render with your MonoTouch render context.
dvkwong wrote at 2011-11-23 09:15:
That solved the problem. Thanks
dvkwong wrote at 2011-11-25 08:52:
Hi,
I have checked in my changes to https://bitbucket.org/dvkwong/oxyplot.monotouch
This contains an example iphone app displaying the graphs from the examples assembly.
Supports png and pdf export as well.
Note the text rendering is not 100% perfect but I am sure someone can help out.
Also I made some minor changes to the core OxyPlot library Eg Allow changing of Default font, and 2 of the assemblies the csproj has ProjectTypeGuids
Thanks
David
objo wrote at 2011-11-25 11:13:
very cool! I'll have a look at the code later! Does it work with the evaluation version?
Can the same code be used to build for Mono for Android?
DateTimeAxis Question
sjren082013 wrote at 2013-08-13 02:48:
bottomAxis[i] = new DateTimeAxis(AxisPosition.Bottom, "时间", "yyyy/MM/dd\nhh:mm:ss", DateTimeIntervalType.Milliseconds);
bottomAxis[i].MajorStep = 1.0 / 3600 / 24;
bottomAxis[i].MinorStep = 1.0 / 3600 / 24 / 10;
bottomAxis[i].ShowMinorTicks = true;
I want to set MajorStep=1 second and Minorstep=0.1 second.when I started,the DateTimeInterval was correct.
But when I set :
bottomAxis[i].Maximum = DateTimeAxis.ToDouble(DateTime.Now);
bottomAxis[i].Minimum = DateTimeAxis.ToDouble(DateTime.Now.AddMinutes(-1));
the DateTimeInterval become 9 Second per step.Why?
Please revert. Thanks in advance.
Regards
System.NullReferenceException while trying to pan before the chart is plotted
jmprog wrote at 2014-01-23 17:49:
I don't know if this bug has already been reported.
I'm currently using OxyPlot with .net 3.5 with Windows Forms and I'm using the heatmapseries with contour series. (The bug happens with the heatmapseries)
When I plot a grid of 400x400, it takes a few seconds to plot and the user has time to interact with the application.
So I reveive an Unhandled Exception everytime I try to Pan the plot before the chart was actually plotted :
System.NullReferenceException: Object reference not set to an instance of an object.
at OxyPlot.Series.XYAxisSeries.InverseTransform(ScreenPoint p) in c:\Users\jmbegin\Desktop\Oxyplot\oxyplot_36df819096f6\Source\OxyPlot\Series\XYAxisSeries.cs:line 126
at OxyPlot.Series.HeatMapSeries.GetNearestPoint(ScreenPoint point, Boolean interpolate) in c:\Users\jmbegin\Desktop\Oxyplot\oxyplot_36df819096f6\Source\OxyPlot\Series\HeatMapSeries.cs:line 252
at OxyPlot.Series.Series.HitTest(ScreenPoint point, Double tolerance) in c:\Users\jmbegin\Desktop\Oxyplot\oxyplot_36df819096f6\Source\OxyPlot\Series\Series.cs:line 123
at OxyPlot.PlotModel.HandleMouseDown(Object sender, OxyMouseEventArgs e) in c:\Users\jmbegin\Desktop\Oxyplot\oxyplot_36df819096f6\Source\OxyPlot\PlotModel\PlotModel.MouseEvents.cs:line 82
at OxyPlot.WindowsForms.Plot.OnMouseDown(MouseEventArgs e) in c:\Users\jmbegin\Desktop\Oxyplot\oxyplot_36df819096f6\Source\OxyPlot.WindowsForms\Plot.cs:line 482
at System.Windows.Forms.Control.WmMouseDown(Message& m, MouseButtons button, Int32 clicks)
at System.Windows.Forms.Control.WndProc(Message& m)
at System.Windows.Forms.Control.ControlNativeWindow.OnMessage(Message& m)
at System.Windows.Forms.Control.ControlNativeWindow.WndProc(Message& m)
at System.Windows.Forms.NativeWindow.Callback(IntPtr hWnd, Int32 msg, IntPtr wparam, IntPtr lparam)
Using a debugger, I tracked the source of the bug. As the exception info said, it happens in HeatMapSeries.GetNearestPoint when it calls this.InverseTransform
    public DataPoint InverseTransform(ScreenPoint p)
    {
           return this.XAxis.InverseTransform(p.X, p.Y, this.YAxis);
    }
jmprog wrote at 2014-01-23 18:03:
if (this.XAxis == null || this.YAxis == null) return null;
This does not have the exact behavior I wanted as it seem to execute all the pans done while not plotted once it plotted, so it's a weird animation.
But for my project, it is enough as it's a rare condition and it still gives the result I want.
objo wrote at 2014-01-23 18:38:
I could not reproduce this bug in the example browser (using WinForms and .NET 4.0).
We can add the test to the HeatMapSeries.GetNearestPoint, but I suspect this is not the only place.
Maybe it would be better to handle this in the PlotModel.HandleMouseDown method - if the plot model is not updated it should not try to perform the hit testing. It is probably more code than the single null reference test, but could solve similar problems in other series.
jmprog wrote at 2014-01-23 19:16:
Although, I'm adding the PlotModel to the Plot.Model only after the thread joined the main one.
I tried removing all the threading I added and the bug still happens.
I also got the same issue with ContourSeries.GetNearestPoint where I added the same fix "if (this.XAxis == null || this.YAxis == null) return null;"
I also tried to reproduce with the example browser and I didn't reproduce it, I'm still investigating on my side to see what is wrong,
jmprog wrote at 2014-01-23 21:59:
after a lot of searching and testing, it really seems like a timing problem where the mousedown event gets triggered before the plotModel is fully updated.
I've had tests that if I stopped the application the problem would not happen like if the delay I gave was enough to let the update get done before the mousedown event.
I've also suceeded in reproducing the bug with the createpeaks exemple in .net 4.5 by adding calculating delay before the update.
To reproduce you can add the loop before adding the model. I saw it happened like that if you can pan before it's plotted.
        private void InitPlot()
        {
            int count = 0;
            for (int i = 0; i < 10000; i++)
            {
                count += i;
                for (int j = 0; j < 10000; j++)
                {
                    if (count > 0)
                        count -= j;
                    else
                        count += j;
                }
            }
            plot1.Model = vm.SelectedExample != null ? vm.SelectedExample.PlotModel : null;
            plot1.BackColor = vm.PlotBackground;
}namespace WindowsFormsDemo
{
using System;
using System.Drawing;
using System.Windows.Forms;
using OxyPlot;
using OxyPlot.Axes;
using OxyPlot.Series;
public partial class Form1 : Form
{
Button refreshButton;
public Form1()
{
InitializeComponent();
refreshButton = new Button();
refreshButton.Location = new Point(this.Width / 2, 30);
refreshButton.Click += refreshButton_Click;
this.Controls.Add(refreshButton);
plot1.SendToBack();
plot1.Model = CreatePeaks();
}
public void refreshButton_Click(object sender, EventArgs e)
{
int count = 0;
for (int i = 0; i < 10000; i++)
{
count += i;
for (int j = 0; j < 10000; j++)
{
if (count > 0)
count -= j;
else
count += j;
}
}
refreshButton.Text = count.ToString();
plot1.Model = CreatePeaks();
}
public static PlotModel CreatePeaks(OxyPalette palette = null, bool includeContours = true)
{
double x0 = -3.1;
double x1 = 3.1;
double y0 = -3;
double y1 = 3;
Func<double, double, double> peaks = (x, y) => 3 * (1 - x) * (1 - x) * Math.Exp(-(x * x) - (y + 1) * (y + 1)) - 10 * (x / 5 - x * x * x - y * y * y * y * y) * Math.Exp(-x * x - y * y) - 1.0 / 3 * Math.Exp(-(x + 1) * (x + 1) - y * y);
var xvalues = ArrayHelper.CreateVector(x0, x1, 400);
var yvalues = ArrayHelper.CreateVector(y0, y1, 400);
var peaksData = ArrayHelper.Evaluate(peaks, xvalues, yvalues);
var model = new PlotModel("Peaks");
model.Axes.Add(new LinearColorAxis { Position = AxisPosition.Right, Palette = palette ?? OxyPalettes.Jet(500), HighColor = OxyColors.Gray, LowColor = OxyColors.Black });
var hms = new HeatMapSeries { X0 = x0, X1 = x1, Y0 = y0, Y1 = y1, Data = peaksData };
model.Series.Add(hms);
if (includeContours)
{
var cs = new ContourSeries
{
Color = OxyColors.Black,
FontSize = 0,
ContourLevelStep = 1,
LabelBackground = OxyColors.Undefined,
ColumnCoordinates = yvalues,
RowCoordinates = xvalues,
Data = peaksData
};
model.Series.Add(cs);
}
return model;
}
}
}elwut wrote at 2014-02-21 15:41:
<Exception><ExceptionType>System.NullReferenceException, mscorlib, Version=4.0.0.0, Culture=neutral, PublicKeyToken=b77a5c561934e089</ExceptionType><Message>Referencia a objeto no establecida como instancia de un objeto.</Message><StackTrace> en OxyPlot.ScreenPointHelper.FindNearestPointOnPolyline(ScreenPoint point, IList`1 points) en c:\TeamCity\buildAgent\work\3b9fcf1ba397d0ed\Source\OxyPlot\Rendering\ScreenPointHelper.cs:línea 56
en OxyPlot.Annotations.PathAnnotation.HitTest(ScreenPoint point, Double tolerance) en c:\TeamCity\buildAgent\work\3b9fcf1ba397d0ed\Source\OxyPlot\Annotations\PathAnnotation.cs:línea 424
en OxyPlot.PlotModel.HandleMouseDown(Object sender, OxyMouseEventArgs e) en c:\TeamCity\buildAgent\work\3b9fcf1ba397d0ed\Source\OxyPlot\PlotModel\PlotModel.MouseEvents.cs:línea 86
en OxyPlot.WindowsForms.Plot.OnMouseDown(MouseEventArgs e) en c:\TeamCity\buildAgent\work\3b9fcf1ba397d0ed\Source\OxyPlot.WindowsForms\Plot.cs:línea 397
en System.Windows.Forms.Control.WmMouseDown(Message&amp; m, MouseButtons button, Int32 clicks)
en System.Windows.Forms.Control.WndProc(Message&amp; m)
en System.Windows.Forms.NativeWindow.DebuggableCallback(IntPtr hWnd, Int32 msg, IntPtr wparam, IntPtr lparam)
en System.Windows.Forms.UnsafeNativeMethods.DispatchMessageW(MSG&amp; msg)
en System.Windows.Forms.Application.ComponentManager.System.Windows.Forms.UnsafeNativeMethods.IMsoComponentManager.FPushMessageLoop(IntPtr dwComponentID, Int32 reason, Int32 pvLoopData)
en System.Windows.Forms.Application.ThreadContext.RunMessageLoopInner(Int32 reason, ApplicationContext context)
en System.Windows.Forms.Application.ThreadContext.RunMessageLoop(Int32 reason, ApplicationContext context)
en QCEP.Program.Main() en c:\Users\gbaquedano\Documents\Visual Studio 2013\Projects\QCEP\QCEP\Program.cs:línea 20
en System.AppDomain._nExecuteAssembly(RuntimeAssembly assembly, String[] args)
en System.Runtime.Hosting.ApplicationActivator.CreateInstance(ActivationContext activationContext, String[] activationCustomData)
en Microsoft.VisualStudio.HostingProcess.HostProc.RunUsersAssemblyDebugInZone()
en System.Threading.ExecutionContext.RunInternal(ExecutionContext executionContext, ContextCallback callback, Object state, Boolean preserveSyncCtx)
en System.Threading.ExecutionContext.Run(ExecutionContext executionContext, ContextCallback callback, Object state, Boolean preserveSyncCtx)
en System.Threading.ExecutionContext.Run(ExecutionContext executionContext, ContextCallback callback, Object state)
en System.Threading.ThreadHelper.ThreadStart()</StackTrace><ExceptionString>System.NullReferenceException: Referencia a objeto no establecida como instancia de un objeto.
en OxyPlot.ScreenPointHelper.FindNearestPointOnPolyline(ScreenPoint point, IList`1 points) en c:\TeamCity\buildAgent\work\3b9fcf1ba397d0ed\Source\OxyPlot\Rendering\ScreenPointHelper.cs:línea 56
en OxyPlot.Annotations.PathAnnotation.HitTest(ScreenPoint point, Double tolerance) en c:\TeamCity\buildAgent\work\3b9fcf1ba397d0ed\Source\OxyPlot\Annotations\PathAnnotation.cs:línea 424
en OxyPlot.PlotModel.HandleMouseDown(Object sender, OxyMouseEventArgs e) en c:\TeamCity\buildAgent\work\3b9fcf1ba397d0ed\Source\OxyPlot\PlotModel\PlotModel.MouseEvents.cs:línea 86
en OxyPlot.WindowsForms.Plot.OnMouseDown(MouseEventArgs e) en c:\TeamCity\buildAgent\work\3b9fcf1ba397d0ed\Source\OxyPlot.WindowsForms\Plot.cs:línea 397
en System.Windows.Forms.Control.WmMouseDown(Message&amp; m, MouseButtons button, Int32 clicks)
en System.Windows.Forms.Control.WndProc(Message&amp; m)
en System.Windows.Forms.NativeWindow.DebuggableCallback(IntPtr hWnd, Int32 msg, IntPtr wparam, IntPtr lparam)
en System.Windows.Forms.UnsafeNativeMethods.DispatchMessageW(MSG&amp; msg)
en System.Windows.Forms.Application.ComponentManager.System.Windows.Forms.UnsafeNativeMethods.IMsoComponentManager.FPushMessageLoop(IntPtr dwComponentID, Int32 reason, Int32 pvLoopData)
en System.Windows.Forms.Application.ThreadContext.RunMessageLoopInner(Int32 reason, ApplicationContext context)
en System.Windows.Forms.Application.ThreadContext.RunMessageLoop(Int32 reason, ApplicationContext context)If you wait for it to finish (like 100ms in my current test) you dont get the crash.
jmprog wrote at 2014-02-21 16:41:
I also specified how to solve this quickly and locally by adding null reference checks directly in the library in the getNearestPoint functions or in your case FindNearestPointOnPolyline.
The ideal solution would be as objo said :
Maybe it would be better to handle this in the PlotModel.HandleMouseDown method - if the plot model is not updated it should not try to perform the hit testing.You can see for yourself which one you want to implement.
I don't have time to look into this myself, but if I'm not the only one that had this bug it would be a good idea to create an issue about it.
objo wrote at 2014-02-25 11:19:
Customer support service by UserEcho
