- General
-
 Vragen

0
Under review
MarkerType.Circle problem
Hi, thank you very much for this amazing library!!
I have a problem and can't find a solution:
this is the result i'm tring to reach :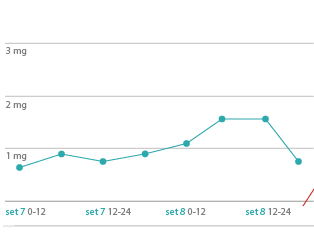
the problem is:
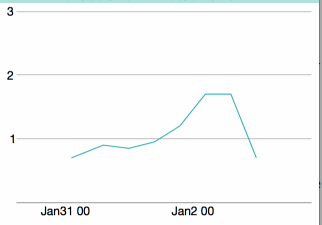
if i set the markerType as circle i can't see any marker:
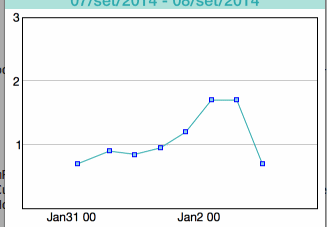
if i set the markerType as any other possibilities it work but adding to my chart a black rectangle around the chart:
This is my PlotModel:
public class OxyPlotModel
{
/// <summary>
/// Gets or sets the plot model that is shown in the demo apps.
/// </summary>
/// <value>My model.</value>
public PlotModel MyModel { get; set; }
/// <summary>
/// Initializes a new instance of the <see cref="OxyPlotSample.MyClass"/> class.
/// </summary>
public OxyPlotModel ()
{
var plotModel = new PlotModel {LegendSymbolLength = 30, PlotType = PlotType.Cartesian};
var xaxis = new DateTimeAxis{
Position = AxisPosition.Bottom,
TickStyle = TickStyle.None,
AxislineStyle = LineStyle.Solid,
AxislineColor = OxyPlot.OxyColor.FromRgb(153,153,153),
StringFormat = (CultureInfo.CurrentCulture.DateTimeFormat.GetAbbreviatedMonthName(1)) + "d HH",
IntervalType = DateTimeIntervalType.Hours
//FirstDateTime = new System.DateTime(2014,10,1)
//new System.DateTime(2014,10,1),
//new System.DateTime(2014,10,10),
//DateTimeIntervalType.Auto
};
var yaxis = new LinearAxis {
Position = AxisPosition.Left,
Minimum = 0.001f,
Maximum = 3,
MajorGridlineStyle = LineStyle.Solid,
TickStyle = TickStyle.None,
IntervalLength = 50
};
plotModel.Axes.Add (xaxis);
plotModel.Axes.Add (yaxis);
var series1 = new LineSeries {
Color = OxyPlot.OxyColor.FromRgb(44,169,173),
StrokeThickness = 1,
MarkerType = MarkerType.Circle,
MarkerStroke = OxyColors.Blue,
MarkerFill = OxyColors.SkyBlue,
//MarkerStrokeThickness = 5,
MarkerSize = 2,
DataFieldX="Date",
DataFieldY="Value",
TrackerFormatString="Date: {2:d HH}
Value: {4}"
};
series1.Points.Add (new DataPoint (0.1, 0.7));
series1.Points.Add (new DataPoint (0.6, 0.9));
series1.Points.Add (new DataPoint (1.0, 0.85));
series1.Points.Add (new DataPoint (1.4, 0.95));
series1.Points.Add (new DataPoint (1.8, 1.2));
series1.Points.Add (new DataPoint (2.2, 1.7));
series1.Points.Add (new DataPoint (2.6, 1.7));
series1.Points.Add (new DataPoint (3.0, 0.7));
plotModel.Series.Add (series1);
this.MyModel = plotModel;
}
I can't understand why this happens and how get around it.
Do somebody know what the problem could be?
Thank you! (sorry for my terrible english^^)
Gabriele
I have a problem and can't find a solution:
this is the result i'm tring to reach :
the problem is:
if i set the markerType as circle i can't see any marker:
if i set the markerType as any other possibilities it work but adding to my chart a black rectangle around the chart:
This is my PlotModel:
public class OxyPlotModel
{
/// <summary>
/// Gets or sets the plot model that is shown in the demo apps.
/// </summary>
/// <value>My model.</value>
public PlotModel MyModel { get; set; }
/// <summary>
/// Initializes a new instance of the <see cref="OxyPlotSample.MyClass"/> class.
/// </summary>
public OxyPlotModel ()
{
var plotModel = new PlotModel {LegendSymbolLength = 30, PlotType = PlotType.Cartesian};
var xaxis = new DateTimeAxis{
Position = AxisPosition.Bottom,
TickStyle = TickStyle.None,
AxislineStyle = LineStyle.Solid,
AxislineColor = OxyPlot.OxyColor.FromRgb(153,153,153),
StringFormat = (CultureInfo.CurrentCulture.DateTimeFormat.GetAbbreviatedMonthName(1)) + "d HH",
IntervalType = DateTimeIntervalType.Hours
//FirstDateTime = new System.DateTime(2014,10,1)
//new System.DateTime(2014,10,1),
//new System.DateTime(2014,10,10),
//DateTimeIntervalType.Auto
};
var yaxis = new LinearAxis {
Position = AxisPosition.Left,
Minimum = 0.001f,
Maximum = 3,
MajorGridlineStyle = LineStyle.Solid,
TickStyle = TickStyle.None,
IntervalLength = 50
};
plotModel.Axes.Add (xaxis);
plotModel.Axes.Add (yaxis);
var series1 = new LineSeries {
Color = OxyPlot.OxyColor.FromRgb(44,169,173),
StrokeThickness = 1,
MarkerType = MarkerType.Circle,
MarkerStroke = OxyColors.Blue,
MarkerFill = OxyColors.SkyBlue,
//MarkerStrokeThickness = 5,
MarkerSize = 2,
DataFieldX="Date",
DataFieldY="Value",
TrackerFormatString="Date: {2:d HH}
Value: {4}"
};
series1.Points.Add (new DataPoint (0.1, 0.7));
series1.Points.Add (new DataPoint (0.6, 0.9));
series1.Points.Add (new DataPoint (1.0, 0.85));
series1.Points.Add (new DataPoint (1.4, 0.95));
series1.Points.Add (new DataPoint (1.8, 1.2));
series1.Points.Add (new DataPoint (2.2, 1.7));
series1.Points.Add (new DataPoint (2.6, 1.7));
series1.Points.Add (new DataPoint (3.0, 0.7));
plotModel.Series.Add (series1);
this.MyModel = plotModel;
}
I can't understand why this happens and how get around it.
Do somebody know what the problem could be?
Thank you! (sorry for my terrible english^^)
Gabriele
Customer support service by UserEcho

Try setting PlotAreaBorderThickness = new OxyThickness(0) to get rid of the border around the plot.
I have added your example under "Discussion examples" in the example library. For WPF it seems to work fine!
I'm using the Xamarin.Ios Nuget Package.
This morning i have updated xamarin at the last version and this solved the circle problem!
Now i can see the circle markers and the rect around the chart appeared too, so i used PlotAreaBorderThickness = new OxyThickness(0) getting rid of it!
So guys if someone has the same problem, updating xamarine.ios solve that!
Thank you very much for the help!!
I think i found a possible bug:
For the purpose of reach the illustreted result, i override the timeAxis class in particular:
protected override string FormatValueOverride (double x)
in which i put in the string:
fmt = fmt.Replace("M",""+ CultureInfo.CurrentCulture.DateTimeFormat.GetAbbreviatedMonthName (time.Month).ToUpper()+"");
It work but it changes some letter of the month name in others letter/numbers like:
OcA <- (should be Oct) 5a14 <- (Mar) 3eb <- Feb etc..
Other are ok like Sep Jan Jun Jul etc
Someone can suggest me a solution?
Thank you