 MarkerType.Circle problem
I have a problem and can't find a solution:
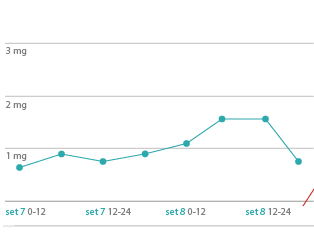
this is the result i'm tring to reach :

the problem is:
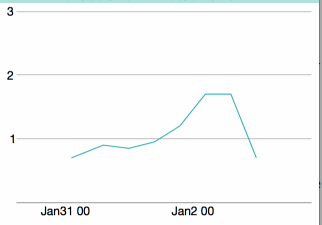
if i set the markerType as circle i can't see any marker:

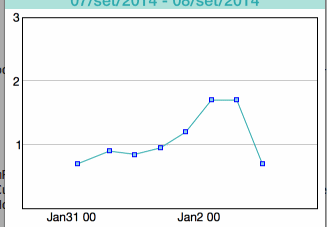
if i set the markerType as any other possibilities it work but adding to my chart a black rectangle around the chart:

This is my PlotModel:
public class OxyPlotModel
{
/// <summary>
/// Gets or sets the plot model that is shown in the demo apps.
/// </summary>
/// <value>My model.</value>
public PlotModel MyModel { get; set; }
/// <summary>
/// Initializes a new instance of the <see cref="OxyPlotSample.MyClass"/> class.
/// </summary>
public OxyPlotModel ()
{
var plotModel = new PlotModel {LegendSymbolLength = 30, PlotType = PlotType.Cartesian};
var xaxis = new DateTimeAxis{
Position = AxisPosition.Bottom,
TickStyle = TickStyle.None,
AxislineStyle = LineStyle.Solid,
AxislineColor = OxyPlot.OxyColor.FromRgb(153,153,153),
StringFormat = (CultureInfo.CurrentCulture.DateTimeFormat.GetAbbreviatedMonthName(1)) + "d HH",
IntervalType = DateTimeIntervalType.Hours
//FirstDateTime = new System.DateTime(2014,10,1)
//new System.DateTime(2014,10,1),
//new System.DateTime(2014,10,10),
//DateTimeIntervalType.Auto
};
var yaxis = new LinearAxis {
Position = AxisPosition.Left,
Minimum = 0.001f,
Maximum = 3,
MajorGridlineStyle = LineStyle.Solid,
TickStyle = TickStyle.None,
IntervalLength = 50
};
plotModel.Axes.Add (xaxis);
plotModel.Axes.Add (yaxis);
var series1 = new LineSeries {
Color = OxyPlot.OxyColor.FromRgb(44,169,173),
StrokeThickness = 1,
MarkerType = MarkerType.Circle,
MarkerStroke = OxyColors.Blue,
MarkerFill = OxyColors.SkyBlue,
//MarkerStrokeThickness = 5,
MarkerSize = 2,
DataFieldX="Date",
DataFieldY="Value",
TrackerFormatString="Date: {2:d HH}
Value: {4}"
};
series1.Points.Add (new DataPoint (0.1, 0.7));
series1.Points.Add (new DataPoint (0.6, 0.9));
series1.Points.Add (new DataPoint (1.0, 0.85));
series1.Points.Add (new DataPoint (1.4, 0.95));
series1.Points.Add (new DataPoint (1.8, 1.2));
series1.Points.Add (new DataPoint (2.2, 1.7));
series1.Points.Add (new DataPoint (2.6, 1.7));
series1.Points.Add (new DataPoint (3.0, 0.7));
plotModel.Series.Add (series1);
this.MyModel = plotModel;
}
I can't understand why this happens and how get around it.
Do somebody know what the problem could be?
Thank you! (sorry for my terrible english^^)
Gabriele

 Proper way to handle real-time data??
ericjzim wrote at 2012-10-10 20:32:
I've been playing around with OxyPlot and found it to almost be a certainty that I recieve a "Collection was modified; enumeration operation may not execute." exception if I try to pan / zoom while adding points to the graph in real time.
What is the proper way to refresh the plot while running?
What is the proper way to add points as to not cause this exception?
Best Regards,
Eric
objo wrote at 2012-10-10 23:07:
Hi Eric, OxyPlot is not locking the model while refreshing. I would like to keep the library simple and think thread synchronization should be handled in the client code (I guess the alternative is to add synchronization objects to every list in the plotmodel?). Please comment everyone that knows more about this than me :-) You could also create a minimal example that we can include in the library, and we will help to make it thread-safe!
Dave_Maff wrote at 2012-10-17 16:47:
So far, the safest way I have found of asynchronously updating a chart series is to add the points to the series from the point generating thread, using the UI dispatcher. Here is a view model which demonstrates this:
namespace MyPlot
{
	public class MyPlotViewModel : INotifyPropertyChanged
	{
		public MyPlotViewModel()
		{
			DataPlot = new PlotModel();

			DataPlot.Series.Add(new LineSeries()
			{
				Title = "Sin(x)",
				Points = new List<IDataPoint>()
			});

			m_userInterfaceDispatcher = Dispatcher.CurrentDispatcher;
			var thread = new Thread(new ThreadStart(AddPoints));
			thread.Start();

		}

		public void AddPoints()
		{
			var x = 0.0;
			var addPoints = true;
			while (addPoints)
			{
				try
				{

					m_userInterfaceDispatcher.Invoke(() =>
					{
						(DataPlot.Series[0] as LineSeries).Points.Add(new DataPoint(x, Math.Sin(x)));
						if (PropertyChanged != null)
						{
							DataPlot.InvalidatePlot(true);
						}

					});
				}
				catch (TaskCanceledException e)
				{
					addPoints = false;
				}
				x = x + 2 * Math.PI / 100;
				Thread.Sleep(10);
			}
		}

		public PlotModel DataPlot
		{
			get; set;
		}

		public event PropertyChangedEventHandler PropertyChanged;

		private Dispatcher m_userInterfaceDispatcher;
	}
}
objo wrote at 2012-10-17 23:25:
Thanks for the example Dave!
Also see the new example using TPL (Examples/Wpf/WpfExamples/Examples/TaskDemo).
I tried to update the plot in a task running with the SynchronizationContext of the UI thread.
NejibCh wrote at 2013-03-09 15:27:
Error 3 Cannot convert lambda expression to type 'System.Delegate' because it is not a delegate type

 Markers, BarSeries and Annotations
ckoo wrote at 2012-03-09 02:26:
Hi Objo,
Have been looking around at the source code and your project looks very interesting.
There are a few things I would like to add to the code base:
- Add the possibility to associate a marker with a DataPoint. Currently the marker is set per Series. I would like to make each DataPoint have different markers within a series. I have had a look at the code and this should not be too difficult. I am only interested
in changing the LineSeries at this stage. However I am wondering which approach would you prefer:
- Create a new type that implementes IDataPoint
- Inherit from DataPoint?
- Extend DataPoint (Add a new public Marker property?)
- Create an annotation that will repeat at a set interval. (i.e. gray out Weekends, when dealing with datetime axes. The annotation would have a concept of "width", as weill as number of "repeats").Should I be using the annotations for this? (i.e. using a rectangle with a gray background, for weekends), or should there be another renderer to deal with a hybrid background-annotation type?
- I had a look at the BarSeries, and was wondering if you had any objections to splitting the class into BarSeries and a Column Series class? (BarSeries would be horizontal and ColumnSeries would be Vertical.)
- I would also like to make changes to the BarSeries so that the Bars could start at different values other than zero. Each bar would would be represented by a start and end value. If no start value is supplied then the baseValue will be used by default.
Thanks
objo wrote at 2012-03-09 08:57:
#1: Shouldn't this be on the ScatterSeries? Then a MarkerType property can be added to the ScatterPoint class
#2: Yes, I think annotations can be used for this. Also see http://oxyplot.codeplex.com/discussions/347917
#3: I have considered this, but found it was possible to support both bars and columns in the same class. Can check again if splitting the class will make it simpler.
#4: See http://oxyplot.codeplex.com/discussions/347779 - I think both the tornado series and the bars with start/end values could be custom series. The logic of the BarSeries is already quite complex - supporting stacked bars, negative values, vertical and horizontal bars, and base values different from zero). Also see the HighLowSeries and CandlestickSeries already existing in the library
ckoo wrote at 2012-03-09 10:55:
#1: Good point. I can use a combination of LineSeries with ScatterSeries to achieve what I want. Thanks for the hint.
#2: OK great. Should be able to easily create a "Region" type based on the PolygonAnnotation type.
#3, #4: The BarSeries is quite complex, that is why I was thinking of splitting it up. The BarSeries and ColumnSeries could both inherit from a base class. The CandleStickSeries looks very similar to what I would like to achieve, except that it needs to be horizontal. I am looking at making a basic Gantt plotModel.
objo wrote at 2012-03-12 06:28:
#3: I splitted BarSeries to BarSeries and ColumnSeries. There is still some refactoring left to do, there is some duplicate code in these classes.
#4: I added a "IntervalBarSeries" that contains items with "start" and "end" value, I think this can be used to create a Gantt chart (have not tested with the DateTimeAxis yet). See the new example in the ExampleLibrary/ExampleBrowser.
ckoo wrote at 2012-03-12 07:29:
Just pulled down the latest revision.
Looks really good.
#4. I will try and spend some time over the next few days playing with this.
Noticed that you replaced ISeries and a lot of interfaces with base classes. Wondering what the reasoning is behind that?
Also noticed the new PlotElement type. Making it serializable and the base to all visual plot elements should allow us to serialise a complete plotmodel and re-create it from a stream. Is that the idea you had behind this?
I wouldn't mind helping out with some documentation, not sure how to go about it.
objo wrote at 2012-03-12 21:45:
See http://msdn.microsoft.com/en-us/library/scsyfw1d(v=vs.71).aspx
I think abstract base classes should be used for the axes, series and annotations. It should be safer for refactoring and versioning, and make the API a bit more restrictive.
I want to add some common functionality to Axes, Series and Annotations in the PlotElement class. Making it [Serializable] was a requirement for the WindowsForms component to work, but it would also be interesting to make the PlotModel serializable as you suggest. Will try that later.
Great if you or anyone else out there would help with some documentation. Send you contributions on my contact form, and I will add it to the wiki. If I am satisfied with the contributions, I can consider changing your role to "Editor".

 Need general tutorial!!
TwitchySticks wrote at 2012-09-05 23:02:
Hi all!
I am using C# in msVS2010 with the WinForms version of oxyplot. I am just trying to understand how to generate a plot so i can finish writing my program but i am currently stuck. Basically i took the code from an example and call it when i double click the oxyplot control in my form, intending to update the control that i am clicking "plot1". The code is below:
var plotModel1 = new OxyPlot.PlotModel();
plotModel1.Title = "Outside";
var linearAxis1 = new OxyPlot.LinearAxis();
plotModel1.Axes.Add(linearAxis1);
var linearAxis2 = new OxyPlot.LinearAxis();
linearAxis2.Position = OxyPlot.AxisPosition.Bottom;
plotModel1.Axes.Add(linearAxis2);
So here is where i am stuck. How do i get the plot, "plot1" to update with the information in "plotModel1"?
Thanks!
objo wrote at 2012-09-05 23:13:
try to set the Model property of the Plot control:
plot1.Model = plotModel1;
TwitchySticks wrote at 2012-09-05 23:23:
Yep that was all i needed! When i get a better handle on this i'll be sure to publish some tutorials to help people out!
Thanks for the great library and the super-fast response!

 Support for Waterfall graphs?
wvd_vegt wrote at 2012-04-21 10:53:
Hi
Is there a way to hav eOxyPlot do waterfall graphs (ie a number of line graphs shifted a bit with their starting points so they appear pseudo 3D).
In old Delphi code I use to code these type of graphs by using area plots (where the line has color and the area is filled with the background color) and plot the graphs from back to front to easily get hidden lines without further computation. The only info needed to plot such curve is a dX and dY value that is multiplied with the graph number and added to the points when plotted. So the 2nd graph is shifted 2*dX, 2*dY right upwards.
---
wvd_vegt
objo wrote at 2012-04-21 13:14:
There is not currently a specialized "WaterfallSeries", but it could be easily added (derived from a ColumnSeries?). I think you can use a RectangleBarSeries to achieve the effect, but then you need to calculate the positions of the rectangles in your model.

 Smoothing
ffiala wrote at 2012-02-27 19:07:
When using the ability of smoothing the resulting curves sometimes do not behave es expected.
Equaly spaced data points
Example1: without smoothing,
http://rapid.iam.at/RapidOxyChart.aspx?dates=0&smooth=0 OK
Example2: with smoothing,
http://rapid.iam.at/RapidOxyChart.aspx?dates=0&smooth=1 OK
Scattered spacing of data points
When positioning the events on a date time scale, the curves go back in time sometimes.
Example1: without smoothing,
http://rapid.iam.at/RapidOxyChart.aspx?dates=1&smooth=0 OK
Example2: with smoothing, http://rapid.iam.at/RapidOxyChart.aspx?dates=1&smooth=1 ??
Could You propose another splining function for these situations?
You see, I dropped all my own attempts to generate SVG-Plots and became a great fan of OxyPlot.

 Handle double click event
guilhermecgs wrote at 2014-05-17 00:04:
I am trying to get the double click event from a ScatterSeries with no success. Is it even possible?
scatterSeries.MouseDown += (s, e) =>
            {
if (e.ChangedButton == OxyMouseButton.Left)
            {
                if (e.ClickCount == 2) // never happens
                {
                  }
            };
 What version(s) of Visual Studio are supported?
Eduarte78 wrote at 2014-01-14 22:00:
I'm currently on VS2010 and getting a runtime error "Could not load file or assembly 'OxyPlot.Wpf, PublicKeyToken=75e952ba404cdbb0' or one of its dependencies. The system cannot find the file specified." on the simple XAML example (<oxy:Plot Model="{Binding MyPlotModel}"/>), with a corresponding public OxyPlot.PlotModel MyPlotModel; object in my viewmodel.
If I have to go install a newer VS I'd like to know which is recommended. Thanks in advance.
objo wrote at 2014-01-16 22:52:
VS2012: the portable library may have some issues with the XAML designer view (this was solved with update 3, but seems to have reappeared)
VS2013: recommended version!

 Is it possible to use this library for periodical data ?
frozzzyy wrote at 2012-06-05 17:24:
Hi all, this is very amazing control library - i like it and i wont to use it in my project, but there is some question, which i wont to ask before.
Is it possible to use this library for periodic data ? I prepared some example - please look at it. Can i make somethink look like this using your library ?
objo wrote at 2012-06-05 20:40:
You can add undefined DataPoints in a LineSeries to create gaps in the line. See the 'filtering invalid points' example in the 'example browser'. The horizontal axis can probably be defined by a TimeSpanAxis or DateTimeAxis.
frozzzyy wrote at 2012-06-05 22:54:
Thank You for your answer! I think - the point of interest is TimeSpanAxis. I am using D3 library now - unfortunately, there are some points, which i can't reach. And, that is why I am looking alternative (WPF) charting library. Ok, if You don't mind - I will ask some more questions:
(Obsolete) 1. Can I programmatically set visible DateTime period using horizontal TimeSpanAxis (or DateTimeAxis) ? - i have custom timeline control in my project - user can set visible period only using it (pan and zoom functionality also available).
2. Can I add some visual elements into plotter ? I mean line, rectange etc. (I need to paint over the area on a plotter using a translucent color - for example - to paint over a period of time when the application runs and draw a few graphs on top of this area. If it is not clear - i can provide some example - what I wont).
UPD: I tried to use RectangleBarSeries - sometimes it works good and exactly how I want, but sometime not:
var rectangleBarItem = new RectangleBarItem {
X0 = DateTimeAxis.ToDouble(activityEntry.From),
Y0 = double.MinValue,
X1 = DateTimeAxis.ToDouble(activityEntry.To),
Y1 = double.MaxValue,
Color = oxyColor };

rectangleBar.Items.Add(rectangleBarItem);
(Obsolete) 3. Can I combine different types of visualization objects in one plotter ? (I mean - few LineSeries with undefined DataPoints plus few ScatterSeries - some about 10 - 15 ;) ).
(Obsolete) 4. Can I customize legend ? (For example - add some image for element in legend, programmatically (or using binding) set visibility of legend ?)
(Obsolete) 5. Can I programmatically or using binding set visibility of LineSeries (ScatterSeries) ?
(Obsolete) 6. Is there some built in scaling functionality ?
(Obsolete) 7. Is there some "auto fit to view" functionality or "fit to view" method ? (If I add one LineSeries with max Y value 10 and after that add new LineSeries with max Y value 1000 - vertical axis change it max value to 1000 automatically?).
Thank You again! (... and sorry for my bad english :) )
frozzzyy wrote at 2012-06-08 12:47:
UP!
I tried to set MajorGridlineStyle and MinorGridlineStyle for axis - when plotter contains some series - it looks good, but if I remove all series from plotter - i get next: pic1 pic2
objo wrote at 2012-06-08 13:26:
frozzzyy wrote at 2012-06-08 13:48:
Good, thank You! Just replace MinorGridlineStyle = LineStyle.Dot to MinorGridlineStyle = LineStyle.Dash and problem is gone!
How about my question from previous post (#2) - is there some solution ?
objo wrote at 2012-06-08 13:56:
#2: it seems there is some bug in the RectangleBarSeries. Will try to reproduce this later.
You can also add line and polygon "Annotations", these will not show up in the legends box.
#4: oxyplot does currently not support bitmap images. You can create custom marker symbols, see one of the examples.
frozzzyy wrote at 2012-06-08 14:23:
objo wrote:
#2: it seems there is some bug in the RectangleBarSeries. Will try to reproduce this later.
You can also add line and polygon "Annotations", these will not show up in the legends box.
#4: oxyplot does currently not support bitmap images. You can create custom marker symbols, see one of the examples.
You can reproduce this using RectangleBarSeriesExamples.cs class from ExampleBrowser:
var s1 = new RectangleBarSeries { Title = "RectangleBarSeries 1" };
s1.Items.Add(new RectangleBarItem { X0 = 2, X1 = 8, Y0 = 1, Y1 = double.MaxValue });
s1.Items.Add(new RectangleBarItem { X0 = 6, X1 = 12, Y0 = 6, Y1 = 7 });
model.Series.Add(s1);
I tried to use poligon annotations and AreaSeries - but such solution doesn't work well for me. RectangleBarSeries is a best solution (item in the legend box, only one object for manipulation in code etc.).
frozzzyy wrote at 2012-06-13 16:05:
Hello again, Objo! Did you try to reproduce issue with RectangleBarItem?
objo wrote at 2012-06-19 12:28:
I will look into this later! I don't think MaxValue/MinValue should be valid data (e.g. these values will be filtered out in the LineSeries). Should create a custom series instead!
Customer support service by UserEcho

