 LogarithmicAxis Reverse and axis label by the data ...
first.. sorry my bad english ..
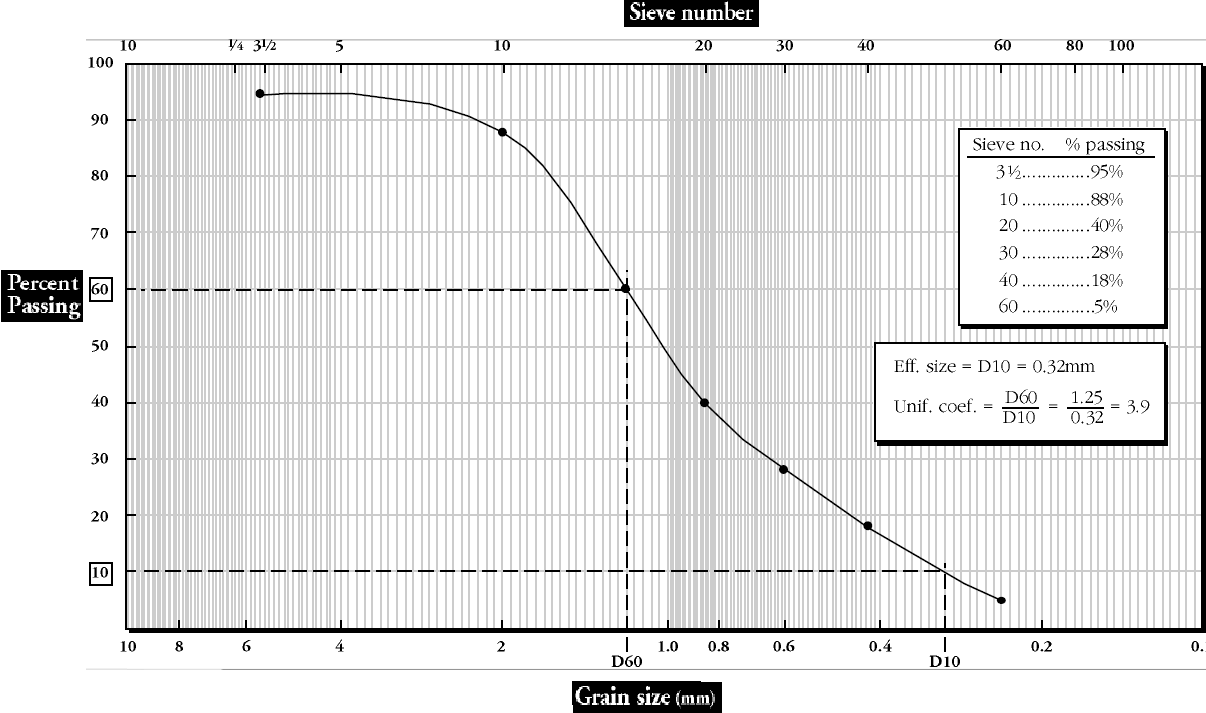
i want this graph ..
but i have two problems..

1. How to LogarithmicAxis Reverse
i tried to set
StartPosition = 1, EndPosition = 0
StartPosition = 100, EndPosition = 10 ...
but .. program infinite loop.
(LogarithmicAxis.cs -> LogDecadeTicks)
2. Bottom, Top x Axis Lable
Bottom x Axis is possible.
but how top x Axis lable.
example data
Y Axis : 0 - 100 %
X Axis :
Sieve No. (X) Passing (Y)
3 95
10 88
20 40
30 28
40 18
60 5
thanks ..

 Line between first and last point in LineChart
Hi
I use the OxyPlot control to plot values in a LineChart. The ItemsSource is a List(of OxyPlot.Datapoint).
My problem is that the first and last point (on the X axis) are bound together with a line. How can I prevent this? I have tried adding a DataPoint of type DataPoint.Undefined at the first position of the data list, but without success.

 Rendered exceptions are going crazy
I have a simple design where I have a PlotView in XAML bound to a PlotModel that is a property of a view-model object.
Within the view-model object, I have code that updates the PlotModel often (because I am plotting real-time data). For some reason, OxyPlot is throwing tons of exceptions at me, and they are all getting rendered to the PlotView, which is quite annoying.
Here is a video of the issue:

As you can see, I am using an AreaSeries. If you'd like to see code, I can post code. Although it is complaining about axes being defined, I have clearly defined the axes.
Any idea what is gong on? Any idea how I can suppress these exceptions from being rendered? They are quite annoying.

 Category axis and label angle
Hi,
I create an oxyplot graphic. I set the bottom axis labels' angle to 90, here is the result:

However, I'd like the labels to be displayed at 90° counter clockwise. To achieve this, I set the angle to 270, but the result is labels overcrossing the graphic's content:

What is the right way to achieve this?

 Oxyplot and multi labeled axis legend
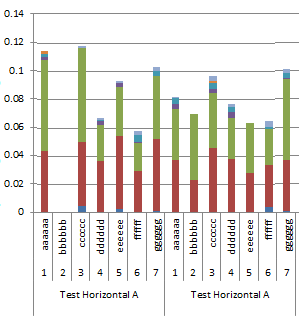
I am creating a graph using the oxyplot library. I have to emulate a graph which, in Excel, looks like the following:

Is it possible to create such axis legend using Oxyplot? I can't seem to find any example in the source code nor on the internet.

 oxyplot: plotmodel, scrollviewer in the middle, wpf
I have an oxyplot chart in the scrolviewer and when the scroll is in the middle i cant move chart from left to right/right to left by right button of the mouse. When the scroll is in the top/bottom all is ok. What can be wrong?
<GridGrid.Row="1" ScrollViewer.CanContentScroll="True" Grid.IsSharedSizeScope="True">
<ScrollViewer Name="viewer" VerticalContentAlignment="Bottom" VerticalScrollBarVisibility="Auto" CanContentScroll="False"><ScrollViewer.Content><oxy:PlotView x:Name="plot"SelectiveScrollingGrid.SelectiveScrollingOrientation="Vertical"Margin="3,3" Model="{Binding PlanData}"VerticalContentAlignment="Stretch" HorizontalContentAlignment="Stretch" /></ScrollViewer.Content></ScrollViewer></Grid>
 Annotations on a realtime LineSerie graph
Hello mates,
I'm using Oxyplot to plot a realtime Line graph (X axis is DateTimeAxis and Y axis is LineAxis) with several lines. All works well.
Now, I want to show on screen the Minimum and Maximum of each LineSerie in the graph. Firstly, I thought this would be easy to achieve with TextAnnotations, but as my X axis moves every second, my annotation simply goes away. I would like it to stay still at the same position on screen.
I've seen someone saying something about using overlay, but I also couldn't get it to work.
Is there a way I can do it without having to update its position everytime the plot refreshes?
Thanks in advance!

 Using Change Log
We are about to push and pull our first change, and wanted to update the ChangeLog. Can you please give us the step by step procedure for updating ChangeLog.Md?

 Box Selection of displayed Scatter points
On a displayed scatter plot, we can select items using a combination of HitTestResult and SelectItem(int). However in order to do a rubberband/marquee selection, we would have to draw a selection box in the plot and then figure out the scatter series' indices under this selection.
My question, does Oxyplot have any existing ways to draw this selection box ? Do I have to use the Rectangle Annotation and the mouse movements to do this ?

 Disable Pan Gesture Xamarin for Scrolling
I am trying to disable Pan gesture in Oxy Plot View. I've set IsPanEbabled for both my axes to false. There is no movement of a plot but I cannot scroll also. I also tried to Clear all Gesture recognizers, but it doesn't help. Is there a way to be able to scroll the whole page while panning on the plot?
Servicio de atención al cliente por UserEcho


