
 IntervalBarItem change label
I have a IntervalBarSeries with some IntervalBarItems. So, to include IntervalBarItems, I Need to convert DateTime into double. Now I have an ugly double-Value (the End-Value) on my BarItems. By changin the Title-Option nothing happens. Is the any possibility to Change the text on my Items?
IntervalBarItem item = new IntervalBarItem

                    {
                        Start = OxyPlot.Axes.DateTimeAxis.ToDouble(data.startTime,
                        End = OxyPlot.Axes.DateTimeAxis.ToDouble(data.endTime),
                        CategoryIndex = i,

                        Title = data.TimeSpanPercental + "%"

                    };

Strongly signed Assembly required - wpf
I cannot build my project. I installed OxyPlot via NuGet. I have a reference to "http://oxyplot.org/wpf" in my window xaml and I can create the oxy plot instance in xaml but when I try to build I get an error stating that a strongly signed assemply is required. any ideas?

ColumnSeries fixed width
Hello,
I'm trying to set a fixed width for ColumnSeries in a CategoryAxis.
My number of category can change but I want to have a fixed width regardless the number of series (if possible align to the left of the axis)

 Make OxyPlot work
I work with VS 2013 and Calibour Micro. I installed OxyPlot for WPF stable version 1.0.0 by using NuGet. But not even the official example works. I wasted at leaset 5 hours of work and I am nowhere.
I am very frustrated.

 Plot not visible
Hi,
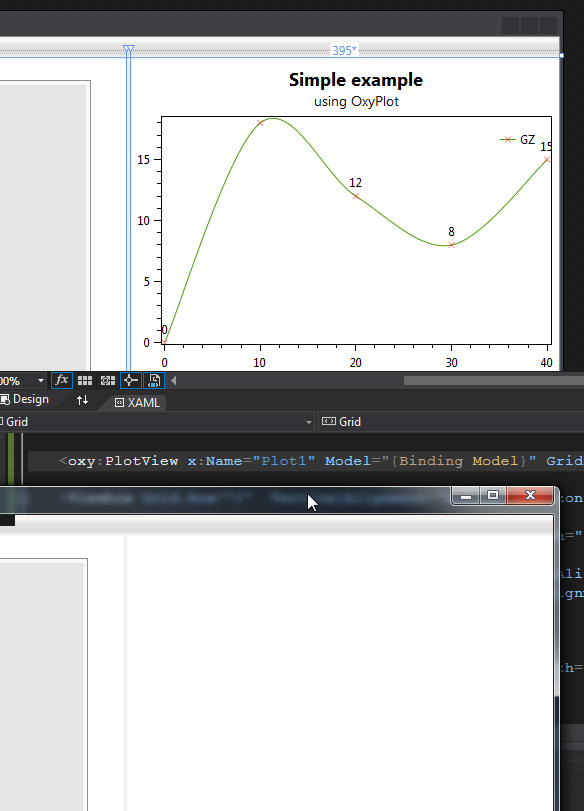
I get my plot visible in the VS 2015 but not in the application in the debug mode. I can press RMB and see the "finger" icon shown when moving the plot area, however nothing is visible form the plot source. Any Ideas?

Stacked list of data on particular date
Hi
I have a single row with status to be shown in month. It can have many statuses everyday and I need this to be stacked

This is actually needed without any values kind of timeline
Set Height for Stacked Bar series Xamarin forms
1
2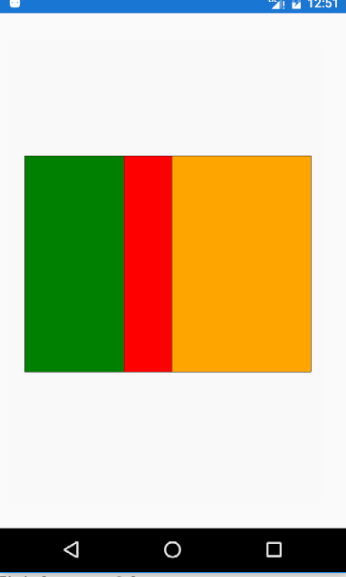
Hi,
I want to show small bar on top of page (1) but it is occupying whole space of page(2).
How to achieve this?

Column Series
Good evening. How are you doing?
I'm working with OxyPlot and I'm currently using Column Series in my project. I have a few columns and their values are set on X and Y, but I wanted the Y value to also be shown above each of its respective column. Is there a way to that? I've been searching but no no avail.
Thank you in advance!

Multible Plots in one Plotview?
Hello,
I have a question how can I display three different graphs in one plotview? In System.Windows.Forms.DataVisualization.Chartingit it was possible to define different chartareas.
How can I achieve this with OxyPlot. Or do I need to add three plotviews?
Regards
Stephan

How to set axis interval space?
I want to set the space between interval in axis, how can I do that?
I'm drawing an image using image annotation and want the left axis to get scaled. Here is the example of what I'm trying to do.
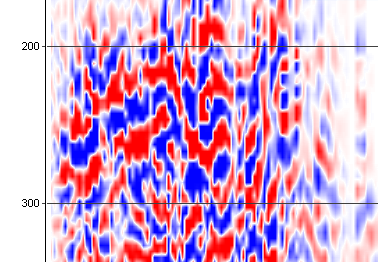
Normal
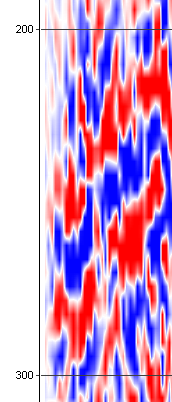
Scaled
Customer support service by UserEcho

