
 InitializeComponent exception
I get an exception whenever I try to use OxyPlot in a UserControl (VS extension), I see that OxyPlot.dll and OxyPlot.Wpf.dll exist in the deployment location, and the XAML parses fine in the designer.
XAML:
<usercontrol x:class="GraphicalDebugging.PlotWatchControl"
             xmlns="http://schemas.microsoft.com/winfx/2006/xaml/presentation"
             xmlns:x="http://schemas.microsoft.com/winfx/2006/xaml"
             xmlns:mc="http://schemas.openxmlformats.org/markup-compatibility/2006"
             xmlns:d="http://schemas.microsoft.com/expression/blend/2008"
             xmlns:oxy="clr-namespace:OxyPlot.Wpf;assembly=OxyPlot.Wpf"
             mc:ignorable="d"
             d:designheight="300" d:designwidth="800">
  <grid>
    <oxy:plotview model="{Binding MyModel}"></oxy:plotview>
  </grid>
</usercontrol>
and in my UserControl class I got:
using OxyPlot;
using OxyPlot.Wpf;
namespace MyNS {
    public partial class MyControl : Usercontrol
    {
        ...
        public PlotModel MyModel { get; private set; }
    }
}
The exception I get is:
System.Windows.Markup.XamlParseException occurred
  HResult=0x80131501
  Message=Could not load file or assembly 'OxyPlot.Wpf, PublicKeyToken=75e952ba404cdbb0' or one of its dependencies. The system cannot find the file specified.
  Source=PresentationFramework
  StackTrace:
   at System.Windows.Markup.WpfXamlLoader.Load(XamlReader xamlReader, IXamlObjectWriterFactory writerFactory, Boolean skipJournaledProperties, Object rootObject, XamlObjectWriterSettings settings, Uri baseUri)
   at System.Windows.Markup.WpfXamlLoader.LoadBaml(XamlReader xamlReader, Boolean skipJournaledProperties, Object rootObject, XamlAccessLevel accessLevel, Uri baseUri)
   at System.Windows.Markup.XamlReader.LoadBaml(Stream stream, ParserContext parserContext, Object parent, Boolean closeStream)
   at System.Windows.Application.LoadComponent(Object component, Uri resourceLocator)
   at GraphicalDebugging.PlotWatchControl.InitializeComponent() in C:\code\git\temp\graphical-debugging\Visual_Studio_2015\GraphicalDebugging\PlotWatchControl.xaml:line 1
   at GraphicalDebugging.PlotWatchControl..ctor() in C:\code\git\temp\graphical-debugging\Visual_Studio_2015\GraphicalDebugging\PlotWatchControl.xaml.cs:line 29
   at GraphicalDebugging.PlotWatch..ctor() in C:\code\git\temp\graphical-debugging\Visual_Studio_2015\GraphicalDebugging\PlotWatch.cs:line 37
Inner Exception 1:
FileNotFoundException: Could not load file or assembly 'OxyPlot.Wpf, PublicKeyToken=75e952ba404cdbb0' or one of its dependencies. The system cannot find the file specified.
I've installed OxyPlot.Wpf via Nuget. Ideas ??

Multiple Color LineSeries
Hello guys,
Does someone know how to perform a Graph like this?
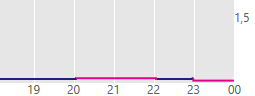
Greets
Timo

 Plot in UWP (Raspberry Pi 3 ) cuts off y axis
Dear all,
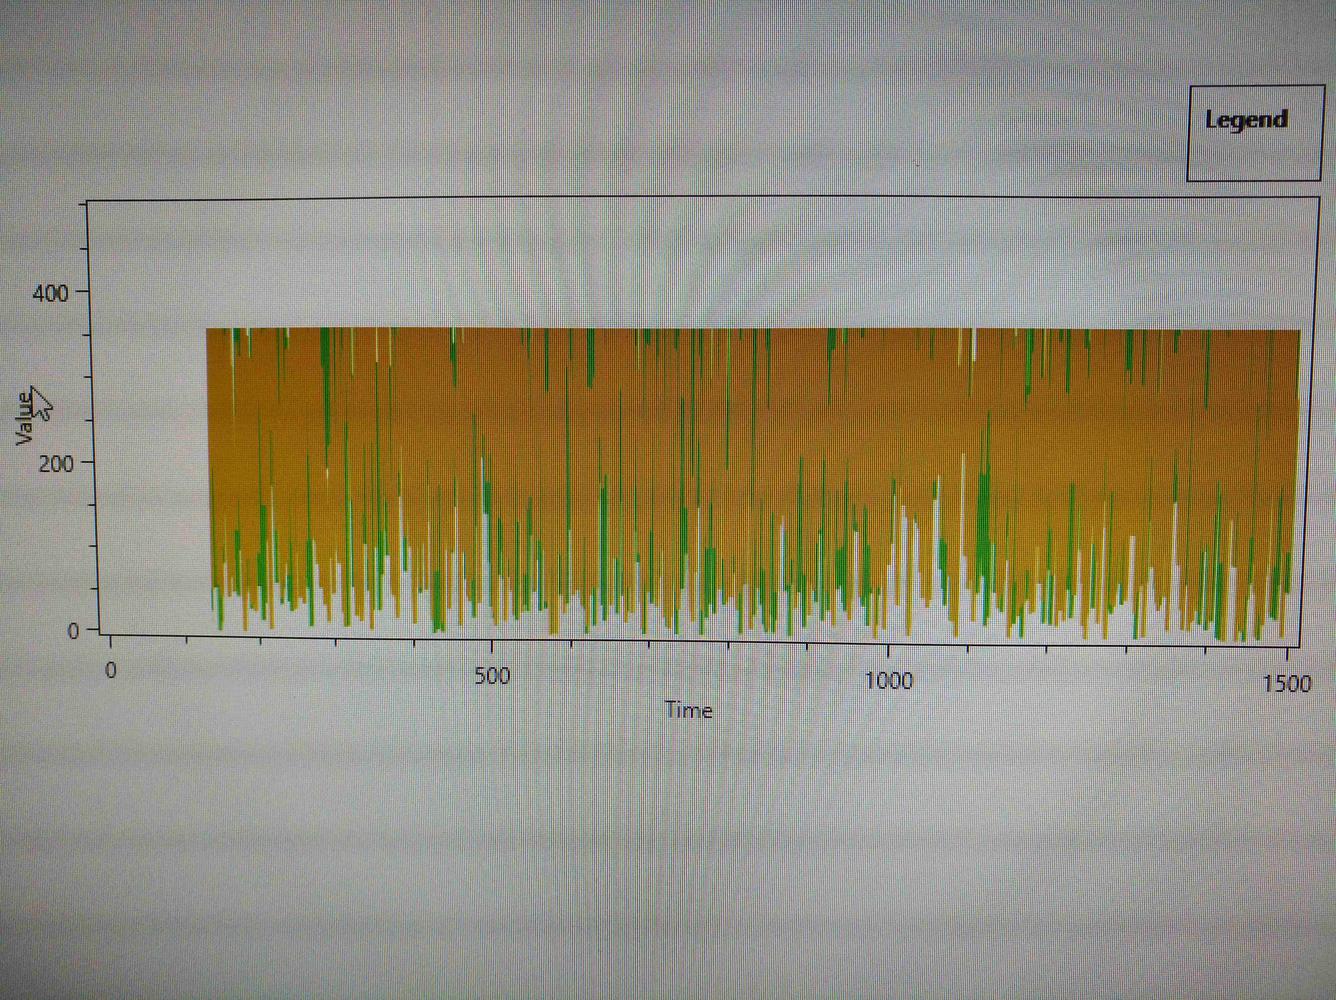
I want to raise one question about a line series in UWP , Raspberry Pi 3, which is cut off at the y axis at 350 and the x axis begins at ~120. Do you have any idea about the reasons?
Thanks in advance,
Markus

Oxyplot xaxis exception
Hi! I'm new to Oxyplot, but I'm trying to understand why this exception happens. There are a few different ways of triggering it, as documented in http://discussion.oxyplot.org/topics/226-oxyplot-paint-exception-xaxis-not-defined/ and elsewhere. There are numerous ways to trigger it, but it seems they center around removing some element and redrawing before everything is quite ready. In my case, I was changing a series dynamically, and the simplest way was to clear the Plot.Series collection, start with a new LineSeries, build it, and then add it to the collection. This throws the exception until I scale or zoom. On the other hand, if I clear the series itself (I know I only have the one series in this plot, so no issue there) and then add the points, voila- I get no exception.
void ThrowsException(){
littlePlot.Series.Clear();
LineSeries littleSeries = new LineSeries();
//Add Points here
littlePlot.Series.Add(littleSeries);
littlePlotView.Refresh();//Throws Exception
}
void WorksFine(){
LineSeries littleSeries = littlePlot.Series[0] as LineSeries;
littleSeries.Points.Clear();
//Add Points here
littlePlotView.Refresh();//Draws properly!
}
Is this a bug? Or is this intended? I can see arguments for both.
Thanks!

Export without Invalidating plot
I want to Export a plot to png. The plot has dark background. I change the background for the export to white, but I do not want to show that change. Unfortunately during the export the plot is invalidated automatically and so the plot flashes white for a moment. Is there a way, how to change the background colour for the plot, but not the view itself?
I am developing WPF application and using the Oxyplot.Wpf library.

PNG exporting is not consistent across PCs (previously was)
Hi, we are using Oxyplot for unit testing where we compare the PNG image exported by the test with a verified baseline. This was working until recently - all of a sudden there are failures due to micro changes in the text rendered in the graph.
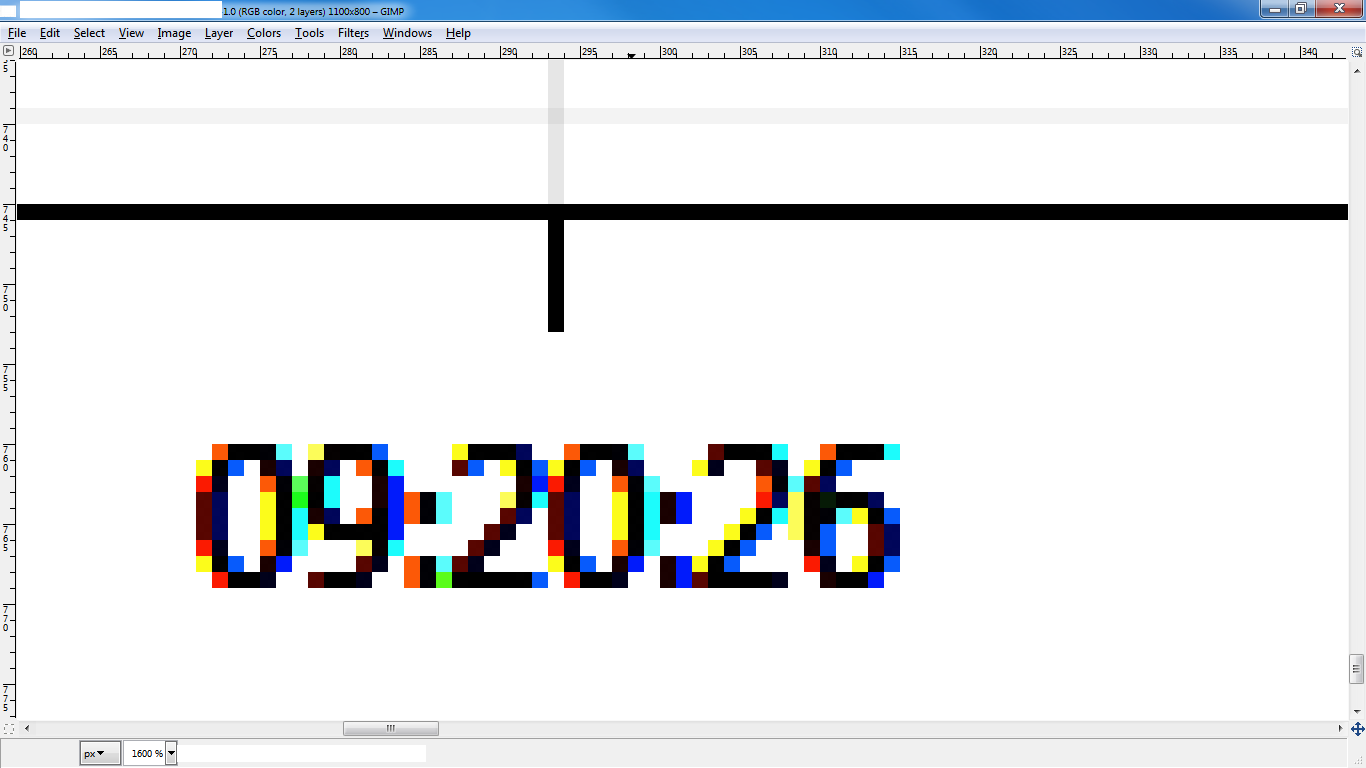
Baseline
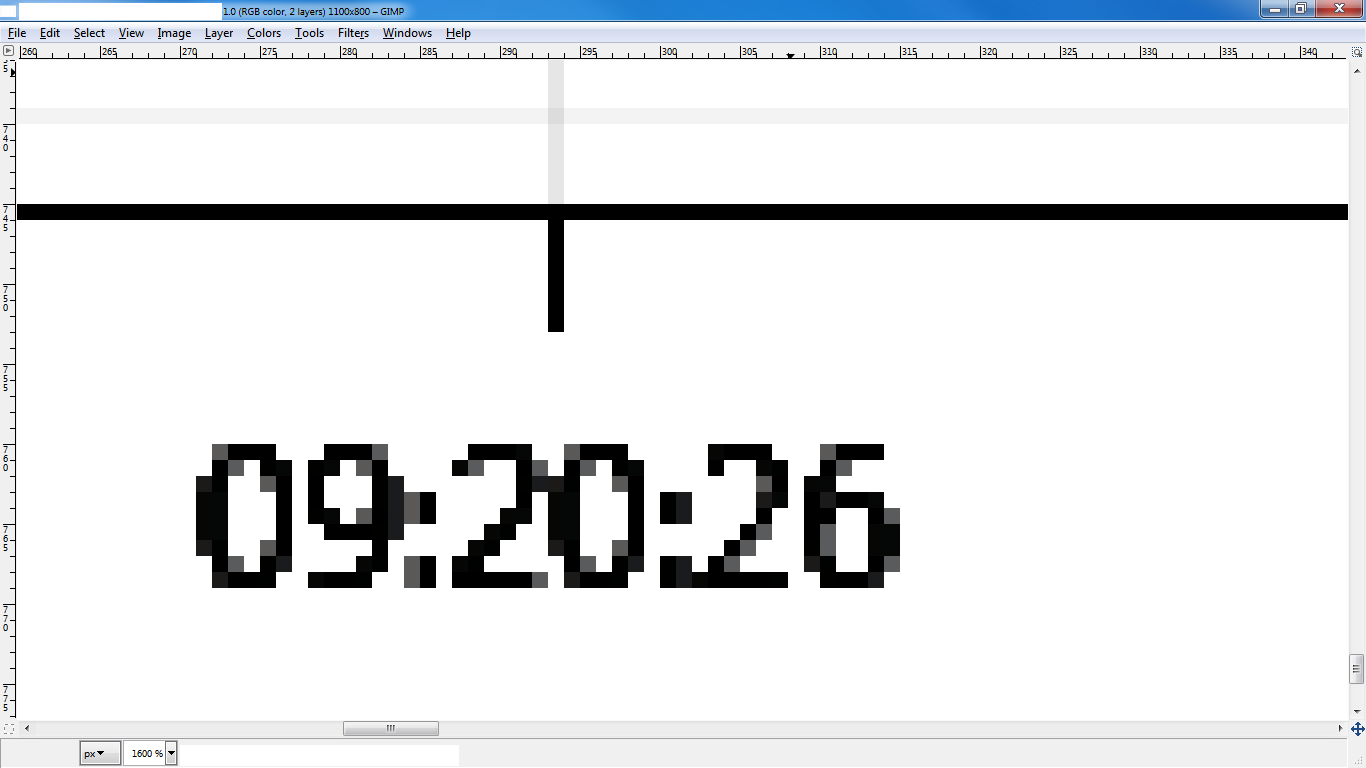
Generated by test
The text which is generated is not consistent across PCs, we are getting different failures. Can you please suggest how we can again start to get consistent exporting in PNGs?
Oxyplot version: 2013.1.52.1
Thanks,
Rishikesh
How to fast Feed large number of data to OxyPlot?
I have about 100k ponits(TComplex[100k] ) to draw.
[StructLayout(LayoutKind.Sequential, Pack = 1)]
public struct TComplex
{
public float Re;
public float Im;
} // end TComplex
The data(along side with a recording time) was returned by an older hardware API to control the machine to start scan.
I want to draw the real part, imaginary part and the amplitude(calculated using Re and Im) of the TComplex[100k]. To feed data to PlotMode, I create a new class "measurement" to contain Re, Im, and Abs:
public class Measurement
{
public double tau { get; set; } // recording time(ms), xlabel
public double Re{ get; set; } // ylabel
public double Im { get; set; } // ylabel
public double Abs { get; set; } // ylabel
}
Then in the viewModel part, the scanning data was feeding to
public Collection<Measurement> Measurements { get; private set; }
by a for loop:
for (int i = 0; i < N; i++)
{
dy += (r.NextDouble() * 2) - 1;
y += dy;
this.Measurements.Add(new Measurement
{
Time =tau[i],
Re = ...,
Im = ...,
Abs = ...
});
}
}
The data was displayed correctly but the for-loop was extremly slow when the scale of scanning data became huge. Is there any fast way to implement this? I just want to implement the matlab routine
plot(x,Re,x,Im,x,Abs) using OxyPlot.

 OxyPlot Line Serie drag a data point
Hi I would lilke to be able to click on a Data Point and move that point to the top of the graph. As example, If I have 3 points (0, 15), (2, 85) and (4, 15), would it be possible to drag point #2 to (2, 100) ? I am working on Xamarin and I believe MouseMove are not supported ? Thanks

How to reset zoom
I have an oxyplot RectangleBarSeries and a button "Reset". When I press the button I want the zoom to reset (in the same way the zoom resets when A is pressed on the keyboard). I've tried the ResetAllAxes(); function, but it doesn't work. Is there any other way to achieve this?

Category axis alignment
Hey there,
I need the left starting and end point of my category axis (x-axis) in order to align a rectangle below which is not part of the plot. Does anybody know how I can align my rectangle to this axis. I cant figure it out because there seems to be a gap between axis label and border of the whole plot which I do not know.
Hope this is enough information. Otherwise just ask.
Customer support service by UserEcho

