
 Xamarin Android crashes when plotview is touched
I have a plotview model using lineseries. I have an issue, while the plotview is updating if I touch the plot, I get an unhandled exception. I have set the axis IsPanEnabled and IsZoomEnabled to false. I have set the view clickable and enabled to false.
How do I disable touching of the plotview?

Is it possible to hide completely Axis labels/values but not Tick Marks/Gridlines?
I tried setting the FontSize to 0 but it crashes, and didnt found any other way to just hide the labels?

How can I add text to a graph?
I am using OxyPlot.Xamarin.Android to plot irregular polygons ( using LineSeries), I want also to add near a line it's length. It is possible to add a text in a graph? I also want the zoom in or out to work on the text like on the lines. Thanks.

 svg export special characters
Hi,
I want to create axis label with special (german) character and export it as svg
the Title of the axis should be "Länge [m]"
I tried:
plotModel.Axes.Add(new LinearAxis
            {
                IsZoomEnabled = false,
                IsPanEnabled = false,
                Title = "Länge [m]",
                Position = AxisPosition.Bottom,
                MajorGridlineStyle = LineStyle.Solid,
                Minimum = auswertungX.Min,
                Maximum = auswertungX.Max
            });
this will result in <text>Länge [m]</text>
with HTML syntax:
"Länge [m]"
it will result in <text>Länge [m]</text>
and with no special syntag:
"Länge [m]"
it will result in <text>L??nge [m]</text>

Oxyplot Pan function override.
How can i add new line series during panning at certain level in oxyplot wpf?

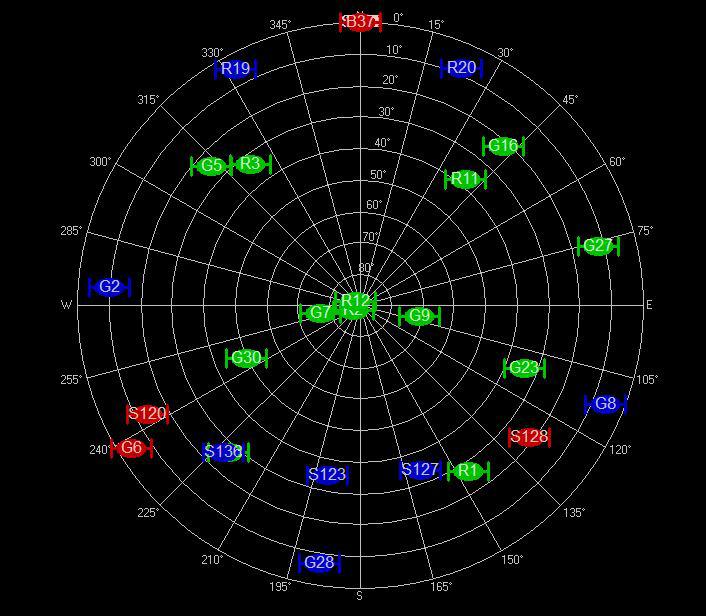
How to reverse MagnitudeAxis
I want to visualize the position of the satellites on the graph using PlotType.Polar. as in the picture. How to reverse MagnitudeAxis?

Oxyplot lineseries and linearaxis
Hi friends,
I want to do that,
lineseris1 and Y1 depends on each other.(Y1 is left axis)
lineseris2 and Y2 depends on each other.(Y2 is right axis)
When I keep to press the right click ,I am dragging the lineseries and
just changing left axis(lineseries1),I want it to move both axis(left
and right axis).
Also,
When the lineseries1 rescale according to receiving values,left axis must change .
When the lineseries2 rescale according to receiving values,right axis must change.

 Plotting minutes on datetime axis
I have seen a few discussions of the following issue, so I'm asking about it again.. I am plotting a data point every 5 minutes using the datetime axis and the labels on the axis say 04:49, 09:59, etc. Basically every time being a second short of 05:00, 10:00 etc. Sometimes it has been 05:01, 10:01 etc. Has there been an authoritative conclusion and possible fix or remedy for such behavior?
RealTime with oxyplot
Hi friends,
I would like to use OxyPlot for RealTime plot ,how can I manage it,like QCustomPlot,x axis must be time series like hh:mm:ss .Any offer?

Tick intervals for month
I use Oxyplot to create a yearly graphic starting November 30th 2016 till November 30th 2017. The plot is drawn more or less ok. But axis labels are not shown for each month although I've provided IntervalType = DateTimeIntervalType.Months and MinorIntervalType = DateTimeIntervalType.Months. Another option that I need is to be able to offset the labels. I need the labels to be not directly under the tick but on the left beetween the nearest ticks.
Customer support service by UserEcho

