
 Is it possible to get a list of axis label strings to change LabelFormatter property based on it?
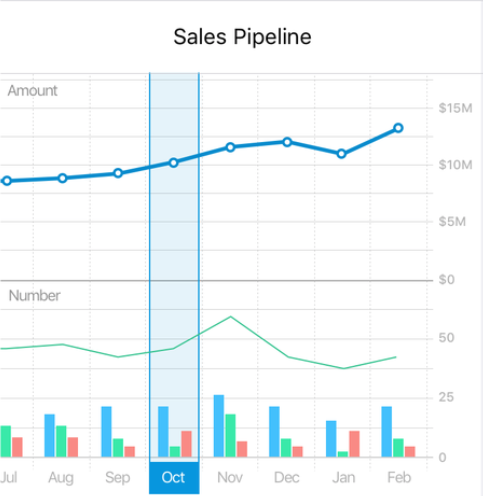
I need to synchronize two plot areas to share the same X axis.
As long as I do not need pinch zooming, the idea is setting Y axis labels to an equal length.
Unfortunately, I cannot find out what will actually be rendered so I do not know "how many whitespaces to insert".
Is that possible with this library?
P.S. Or I should go with "using as single plot area" + "tweak the dataset and labels in the upper part".

[WPF] Stacked Linear Bar Series
Is there any way to make the LinearBarSeries show stacked plots like ColumnSeries? It seems as if I have two plots at the same X-Axis with different Y-Axis values the larger value will cover the smaller one.


When will the documentation be updated?
I'm trying to understand the Controller while using Xamarin.Forms.OxyPlot because I want to add a Tapgesture, but there is 0 documentation abouth this which makes this impossible.

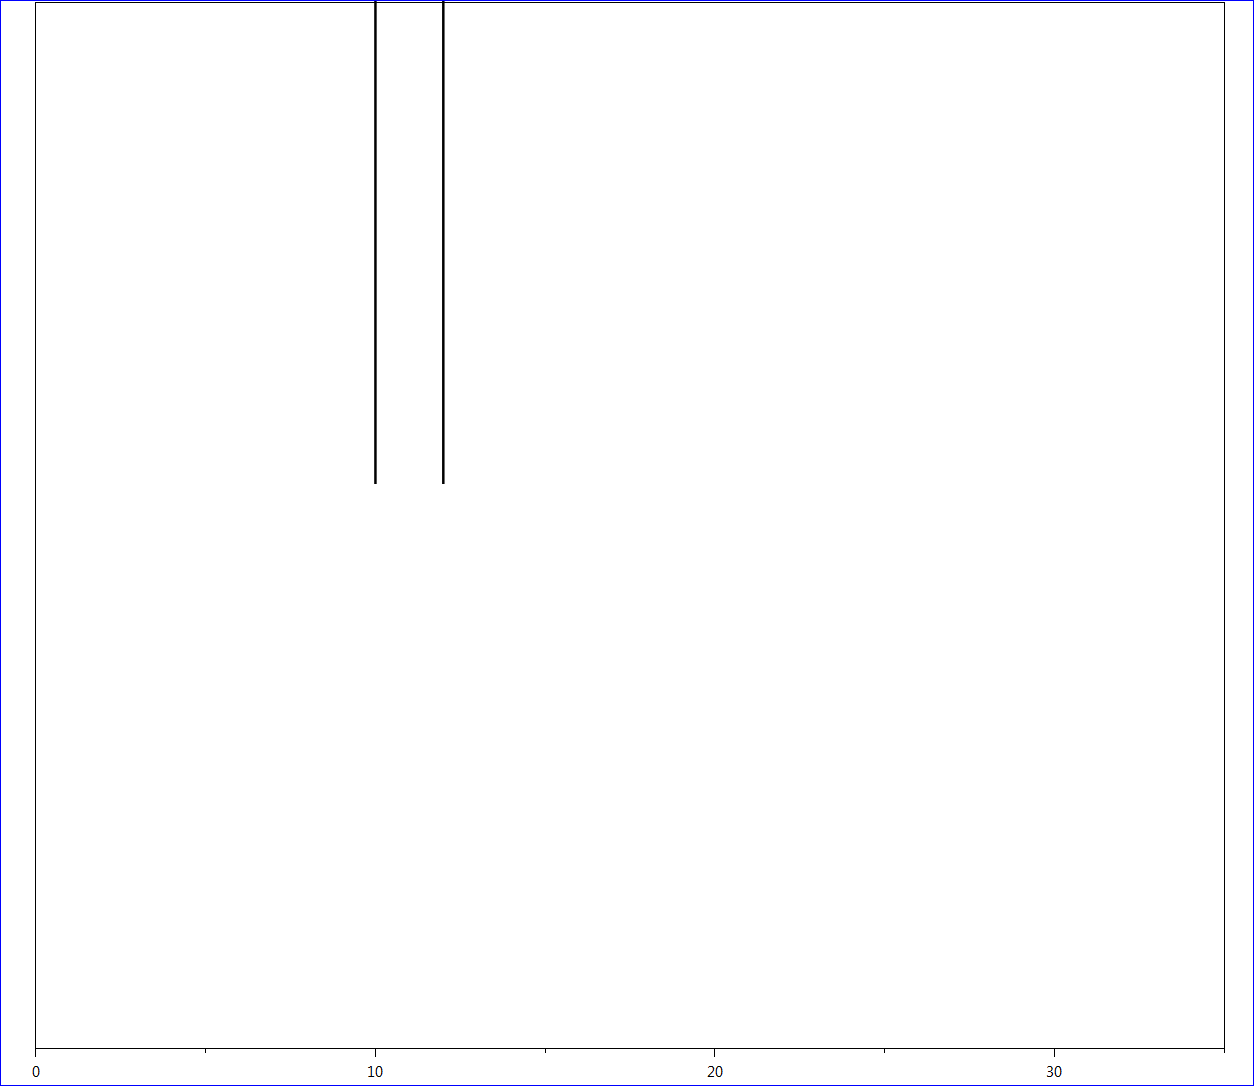
Vertical Line and Vertical Area (WPF XAML)
How to add or draw vertical line/vertical area in a PlotModel (WPF XAML)?

Plots out of view when plotting using reversed y axes
I modified the AxisExample - Reversed like below
<code>
public static PlotModel Reversed()
        {
            var plotModel1 = new PlotModel();
            plotModel1.Axes.Add(new LinearAxis
            {
                Position = AxisPosition.Left,
                StartPosition = 55,
                EndPosition = 0,
                MajorStep = 10,
                Key = "Y1"
            });
            plotModel1.Axes.Add(new LinearAxis
            {
                Position = AxisPosition.Right,
                StartPosition = 55,
                EndPosition = 0,
                MajorStep = 10,
                Key = "Y2"
            });
            var series1 = new LineSeries();
            series1.Color = OxyColors.Black;
            series1.YAxisKey = "Y2";
            series1.Points.Add(new DataPoint(10, 45));
            series1.Points.Add(new DataPoint(10, 30));
            series1.Points.Add(new DataPoint(21, 30));
            series1.Points.Add(new DataPoint(21, 15));
            series1.Points.Add(new DataPoint(31, 15));
            series1.Points.Add(new DataPoint(31, 0));
            plotModel1.Series.Add(series1);
            var series = new LineSeries();
            series.Color = OxyColors.Black;
            series.YAxisKey = "Y1";
            series.Points.Add(new DataPoint(12, 27));
            series.Points.Add(new DataPoint(12, 15));
            series.Points.Add(new DataPoint(31, 15));
            series.Points.Add(new DataPoint(31, 0));
            plotModel1.Series.Add(series);
            plotModel1.Axes.Add(new LinearAxis
            {
                Position = AxisPosition.Bottom,
                Minimum = 0,
                Maximum = 35,
                MajorStep = 10,
                MinorStep = 5,
            });
            return plotModel1;
        }
</code>
The resulting plot:
After zooming and panning (expected results):
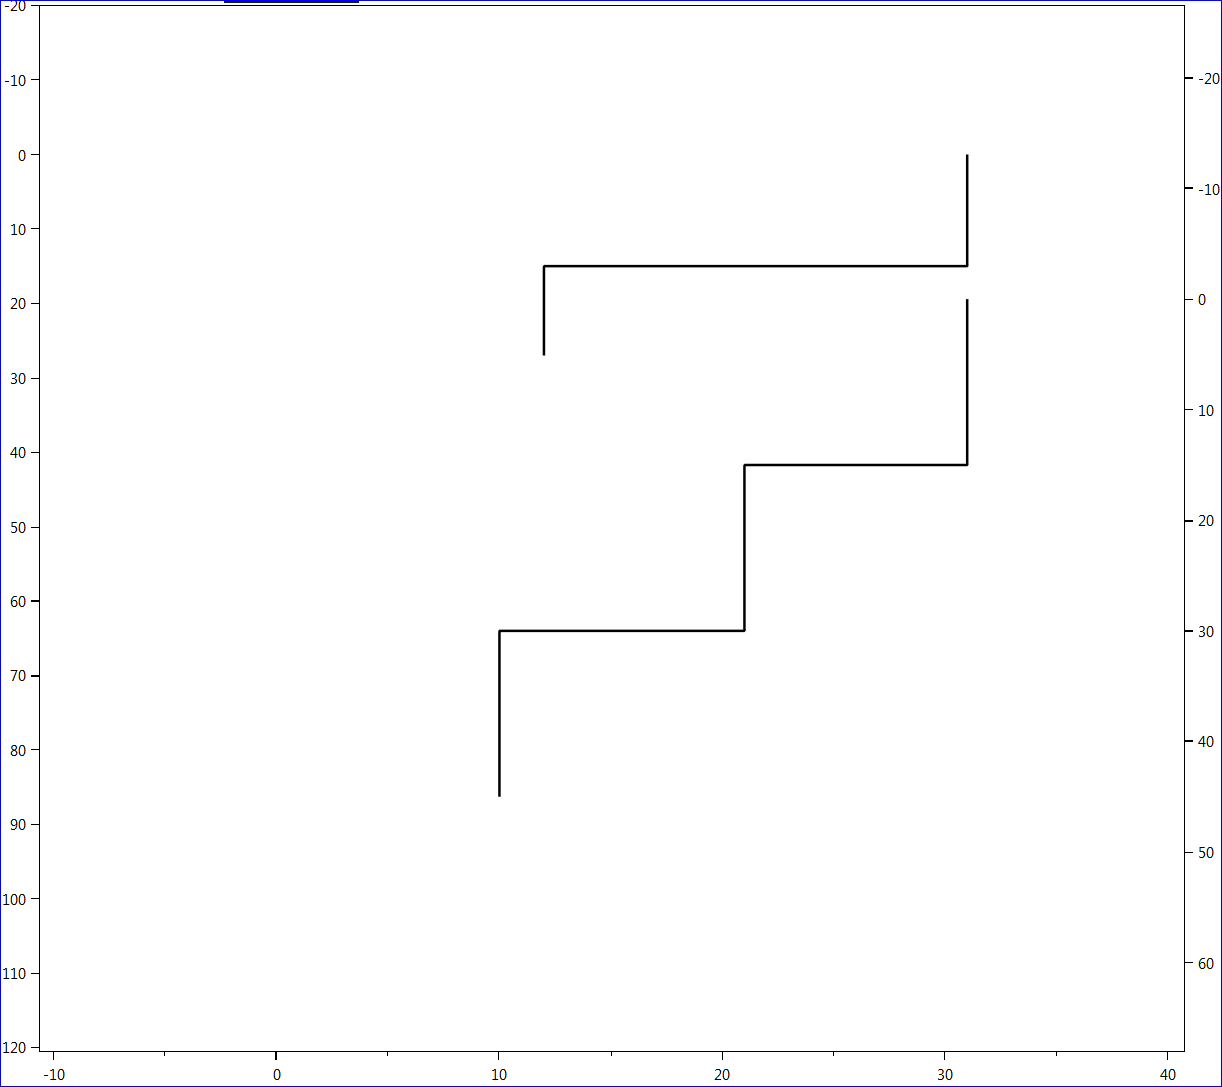
What is going wrong in my code? Not able to figure out.
Thanks

Visual Studio 2017 - Xamarin.Ios not deplyoing
Good Morning all,
I've started using Oxyplot chart for Xamarin.Ios, and it seems very easy to use it, but my problem is that when i try to debug to any device, it simple give me an error, but doesnt tell me what is wrong.
the only thing I need to do for the error to occur is to using OxyPlot.Xamarin.iOS; and Visual Studio dont do nothing, if i remove the "using" it start working again....
I'm using Visual Studio 2017 with the latest Xamarin and also using MVVMcross .
Maybe this version of Oxyplot is not compatible with the newer versions ov VS and Xamarin ?
I've the reference : OxyPlot, OxyPlot.Xamarin.IOS
Can anyone help me please ?
Best Regards,
Dionisio Luis

Can OxyPlot do a Strip Chart style plot?
Can Oxyplot be used for a strip chart style plot? Where you have a fixed x-axis (usually time) and adding new data points causes the plot to scroll to the left across the screen as more data points are added.

 How to get digital signature for OxyPlot.dll and OcyPlot.Wpf.dll?
I am working on a product which used these two dlls. However we are missing the digital signatures for both of them. Does anybody know how we can get them digitally signed?
Thank you for your help!
best regards,
kaija
Customer support service by UserEcho
