
 How to draw AreaSeries with all of points in lineseries with Y > 50
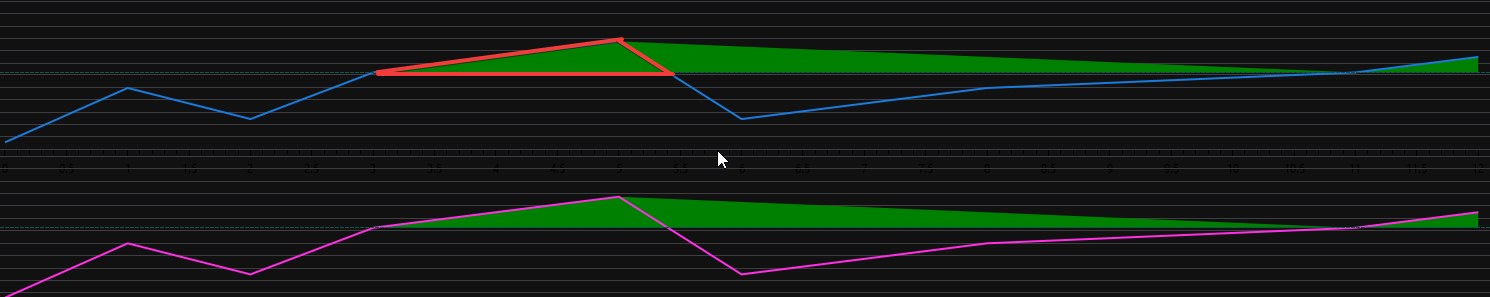
I want to draw AreaSeries with all of points in Lineseries with Y > 50. But I got the result like image below.
I just want to draw AreaSeries in red rectangle area.
var areaSeries = new AreaSeries()
{
StrokeThickness = 2,
LineStyle = OxyPlot.LineStyle.Solid,
Color = OxyColors.Transparent,
Color2 = OxyColors.Transparent,
Fill = OxyColors.Green,
DataFieldX2 = "X",
ConstantY2 = 50,
};
// Fill series with initial values
foreach (var point in seriesLumen.Points)
{
if (point.Y >= 50)
{
areaSeries.Points.Add(point);
}
}
tmp.Series.Add(areaSeries);

Does Oxyplot area series can be filled with gradient color
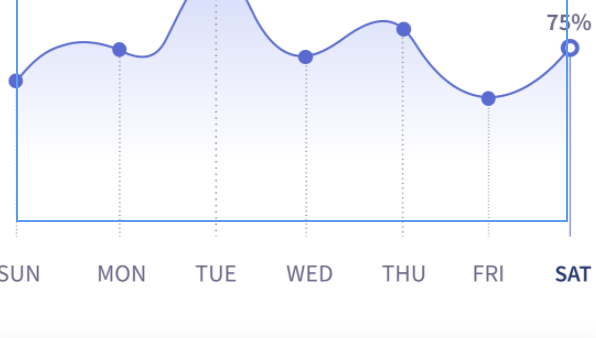 Does Anyone suggest any other chart view to achieve below graph

 StringFormat of TimeSpanAxis
What is the format of the StringFormat to give to TimeSpanAxis?
Thanks

How to Display All axes in positive number
Hi All,
I implemented this diagram with Oxyplot and WPF.
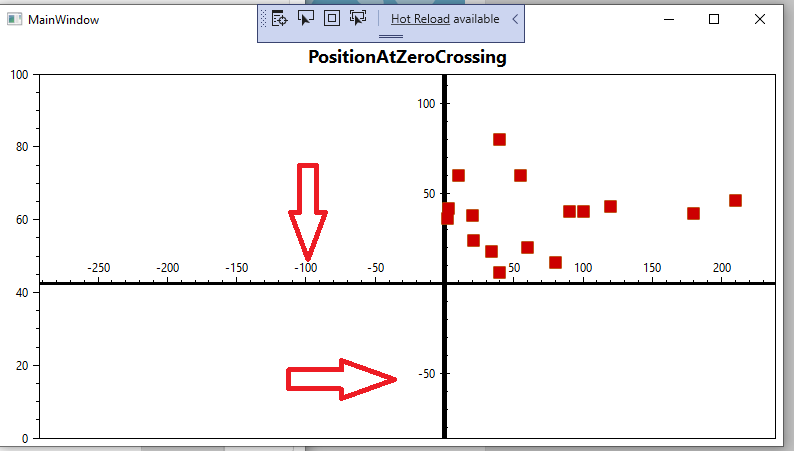
How can you make the 4 axes positive?
is there an idea?
Many thanks to
Many thanks

Drag points up or down in a line series
Hi Team,
I want to drag or move the points up/down to new position in a lineseries.
kindly do the needful on this

How to move the line series points in vertical direction only
Hi team,
I am using Oxyplot.wpf . I want to move the lineseries points by selecting single point in vertical direction only.
something similar to gamma curve. First and last point of lineseries points will be permanent(not movable).
and will be linear section at low end.
.

Poor Rendering Performance with LinearAxis and LineSeries with 72k DataPoints
Hi,
i have a LineSeries with 72k Datapoints, Rendering time is about 20sec.
Is this normal? How can i speed up the rendering.
I am using LinearAxis for X and Y axis, LineSeries is bound to IEnumerable of OxyPlot DataPoints.

How to Add XAxis of CandleStickSeries?
I Want know this Topic...
ps : Now, my Current XAxis is showing default date (ex : 1899.09.01 ... etc)

Bad UI response when the rendering points is too big

Tracker vertical line thickness in WPF
Is there any possibility to change trackers vertical line thickness. I found only color setting.
Customer support service by UserEcho

