 Creating PDF-Files
hello,
I'm trying to create an easy pdf-file in Oxyplot. Here's my code:
using Xamarin.Forms;
The problem is that I can't write a string in the parameter of doc.save(
Instead I should give a System.IO.Stream as the parameter. How should I create a stream that I can use as the parameter. Thank you for your help in advance.

 1 Area Series with 2 Colors based on limit
I've looked for a bit, but I couldn't find anything quite like this. I know TwoColorAreaSeries is quite similar, Is there currently a way to do something like this?:

So when it's above/below the limit, the fill color is different, but the color still fills all the way to the bottom.

 Odd Marker Placement With LineSeries
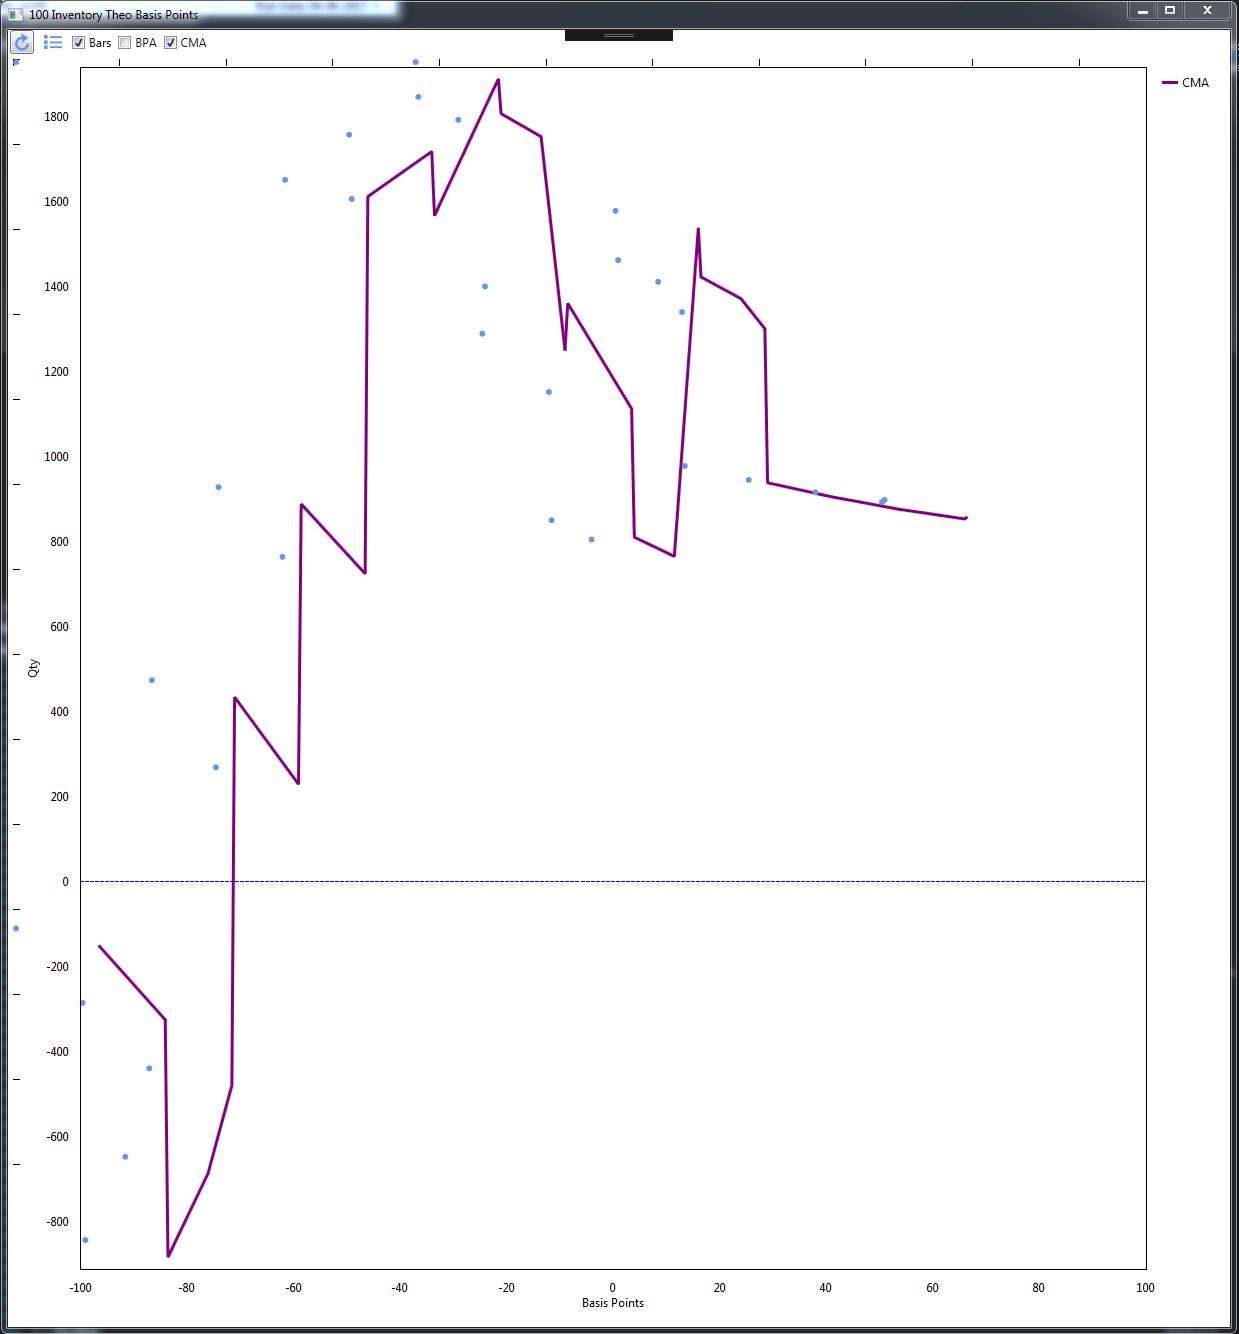
I am coding a basic Cumulative Moving Average LineSeries with the MarkerType = MarkerType.Circle. For some reason my Marker is ending up not on the line. Pan and Zoom are disabled on my Y axis. I have included a picture of it. Anyone know of a reason why it would be doing this?


 How do I bind my oxyplot graph to a specific property in my model?
I've started working with Oxyplot for my mobile application. Whilst I can get it working with static values that I define I'm struggling to get it to work with my model.
My model grabs data from my Azure database, the model looks like this.
    using System;

    namespace MyProject
    {
        public class tbl_utilisation
        {

            public string id { get; set; }
            public string psv { get; set; }
            public string ahts { get; set; }
        }
    }
I'd like to return `ahts` to my line graph as one series and `psv` to my line graph as another series. I thought perhaps something like
    <oxy:PlotView Model="{Binding tbl_utilisation}">
        <oxy:Plot>
            <oxy:Plot.Series>
                <oxy:LineSeries ItemsSource="{Binding ahts}" />
                <oxy:LineSeries ItemsSource="{Binding psv}" />
            </oxy:Plot.Series>
        </oxy:Plot>
    </oxy:PlotView>
This however throws an exception of:
`System.Reflection.TargetInvocationException: Exception has been thrown by the target of an invocation.`
Can anyone help me understand where I've gone wrong and perhaps assist me in getting this graph working? The documentation on the site is'nt the best at the moment so I am finding my way in the dark just now.
Many thanks

 Limit LineSeries processing when used with HUGE number of data points
Hi,
I have LineSeries with over 2M data points(smoothing is off, no markers, no background image, solid line with thickness of 0.5) my app is easily get into unresponsive state.
Is there an easy way to limit the processing of Oxyplot to only a certain window of smaller size, for example, 7K data points? I tried to adjust the maximum and minimum of the x axis, however, it didn't turn out to help much. Will appreciate if someone could suggest how to approach this.
Thanks,
Mike

 VERY bad performance of OxyPlot LineSeries with over 2M in one plot(WPF)
Hi, I'm experiencing a VERY bad performance with oxyplot graph, specifically, 3 LineSeries with over 2M points. I'm not drawing anything fancy, the background is with solid color with no images and no markers or anything like that. The graph cannot be even scrolled properly.
I wished I was aware to this performance hit before I implemented my whole project with this library... Is there some solution with how to deal with such issues? Is there a DX wrapper ready to boost the performance?
I would also like to know why after loading all the items(over 2M)when there is no activity(such as adding, panning, zooming) the application response is very slow? are there oxyplot updates that are happening in the background? Is there some way to "lock" the graphs?
Thanks, Mike

 Move scatterpoint
hello, I try to drag a scatterpoint, but I can't seem to find the way to do it. I see the point has x and y properties, but they are read only. Can I move the point without having to delete and recreate it

 OxyPlot does not update view when adding Points (Dispatcher)
I'm working on a performance monitor showing plotting some x/y Points as AreaSeries. For presentation I'm updating my view several seconds and adding measuring points. Because of `InvalidOperationException`, I need to add the points inbetween a Dispatcher. I want to see the added points real-time - but the view does not update. There is no issue with the points or anything other, because adding all points before, I get my Plot.
.xaml file
    <UserControl x:Class="Gauge_3.PerformanceMonitor"
                 xmlns="http://schemas.microsoft.com/winfx/2006/xaml/presentation"
                 xmlns:x="http://schemas.microsoft.com/winfx/2006/xaml"
                 xmlns:mc="http://schemas.openxmlformats.org/markup-compatibility/2006"
                 xmlns:d="http://schemas.microsoft.com/expression/blend/2008"
                 xmlns:local="clr-namespace:Gauge_3"
                 xmlns:oxy="http://oxyplot.org/wpf"
                 mc:Ignorable="d"
                 d:DesignHeight="300" d:DesignWidth="300">
        <Grid>
            <Grid.RowDefinitions>
                <RowDefinition/>
                <RowDefinition />
                <RowDefinition />
            </Grid.RowDefinitions>
            <oxy:PlotView x:Name="fMonitor" Grid.Row="0" HorizontalContentAlignment="Stretch"/>
            <oxy:PlotView x:Name="sMonitor" Grid.Row="1"/>
            <oxy:PlotView x:Name="nMonitor" Grid.Row="2"/>
        </Grid>
    </UserControl>
.cs snippet, calling from another class
    public void PlotRealTime(double percent)
            {
                this.Dispatcher.Invoke(DispatcherPriority.Normal, new Action(() =>
                {
                    DataPoint dPoint = new DataPoint(new DateTime(2017, 01, 01, 14, internalCounter, 00).ToOADate(), percent);
                    sArea.Points.Add(dPoint);
                    if (internalCounter == 0)
                        sMonitor.Model.Series.Add(sArea);

                    sMonitor.Model.InvalidatePlot(true);
                }));

                internalCounter++;
            }

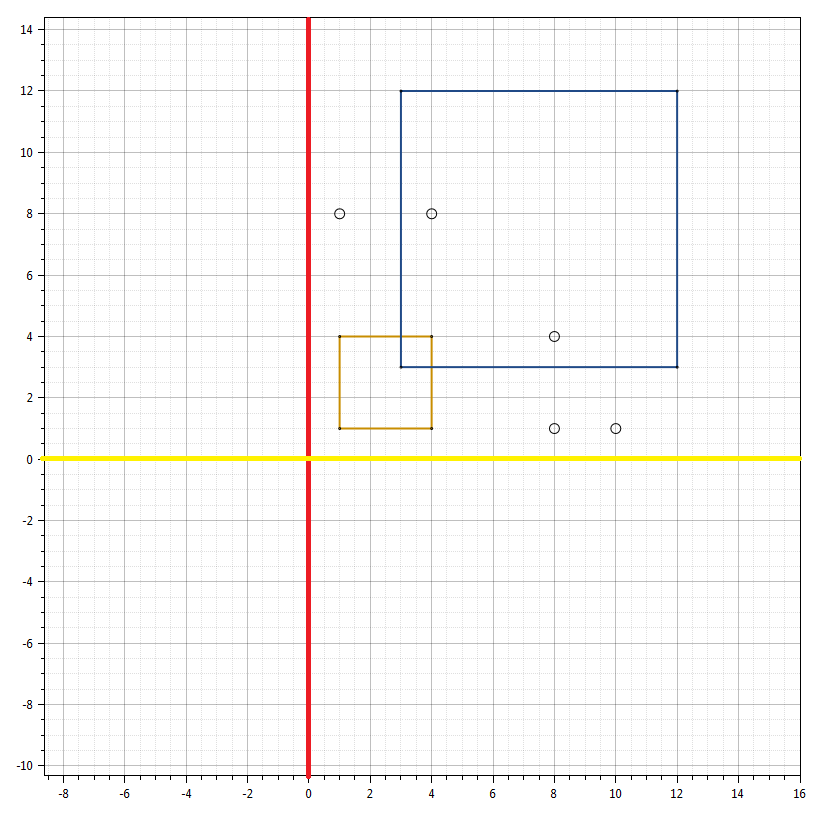
 Show me the x-axis and the y-axis in OxyPlot

| I want to let the yellow and red line indicate to me. Is there any command to display the x-axis and the y-axis and to color it? |

 Different pan-behaviour touch and mouse
I am using oxyplot on a touch-panel computer.
If I use the mouse to pan along x-axis it is smooth. If I use my finger on a touch-panel it is not a smooth panning.
Is there a possibility to smoothen touch-panning?
Thanks a lot,
Philipp
Служба підтримки клієнтів працює на UserEcho


